Fibonacci Retracements Analysis 20.10.2017 (EUR/USD, USD/JPY)
EUR USD, “Euro vs US Dollar”
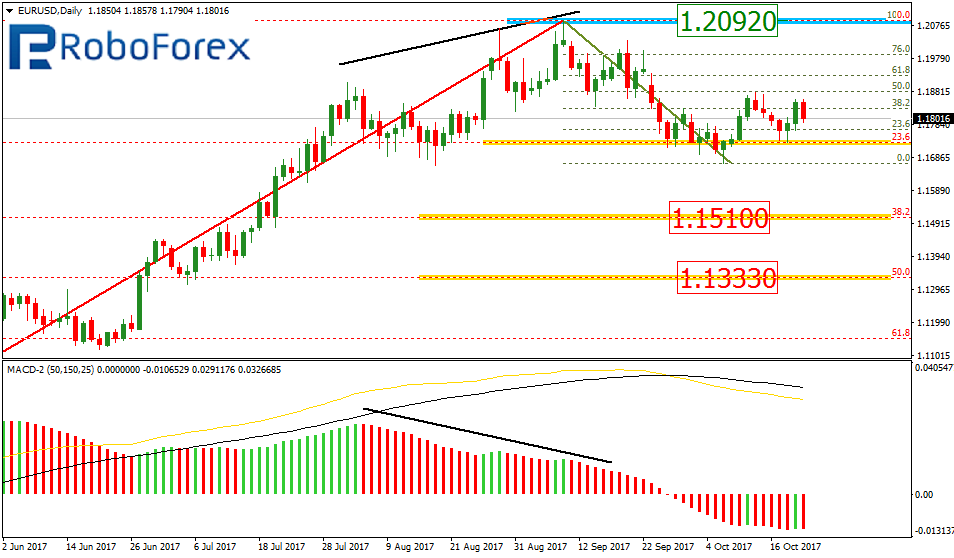
As we can see at the daily chart, the EUR/USD pair is still being corrected to the downside. By now, the correction has already reached the retracement of 23.6%. The next possible targets of the correction may be the retracements of 38.2% and 50.0 at 1.1510 and 1.1333 respectively.
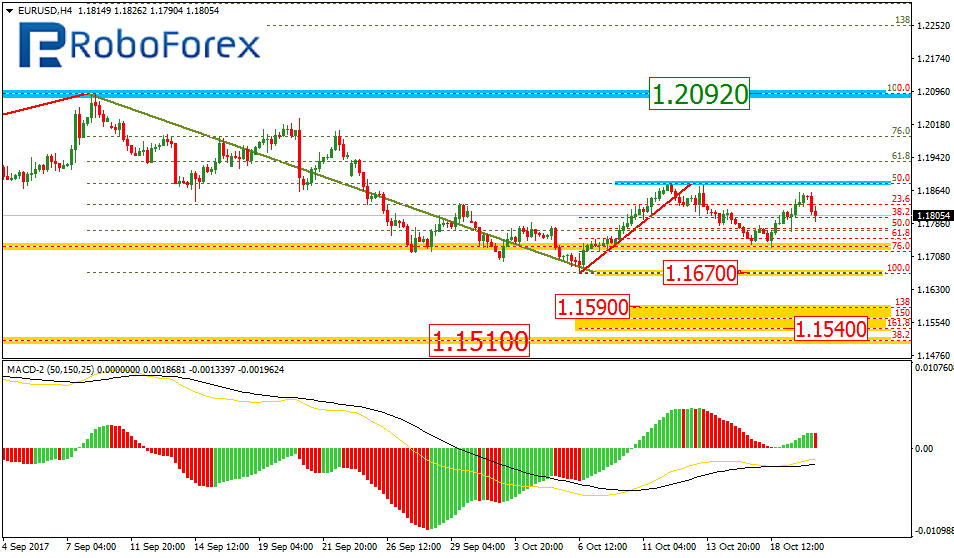
At the H4 chart, the EUR/USD pair was corrected to the upside by 50.0% and then started forming another descending impulse. After breaking the local low at 1.1670, the price may move towards the post-correctional extension area between the retracements of 138.2% and 161.8% at 1.1590 and 1.1540 respectively.
USD JPY, “US Dollar vs. Japanese Yen”
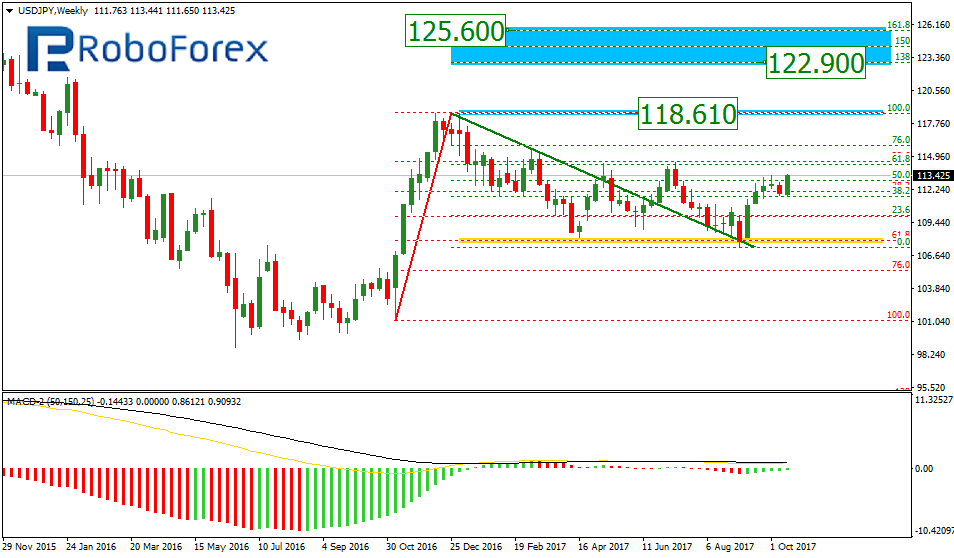
At the weekly chart, the USD/JPY pair was corrected to the downside by 61.8% and then started forming another ascending wave. The main targets of this wave may be inside the post-correctional extension area between the retracements of 138.2% and 161.8% at 122.90 and 125.60 respectively. The resistance level is close to the high at 118.61.
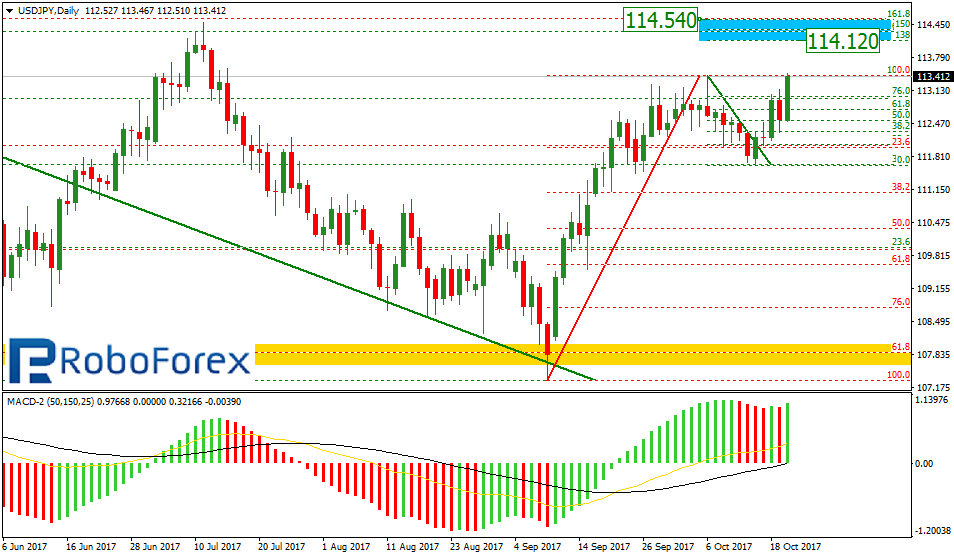
As we can see at the daily chart, the pair is testing this month’s high and trying to break it. The upside target area is inside the post-correctional extension area between the retracements of 138.2% and 161.8% at 114.120 and 114.540 respectively.
RoboForex Analytical Department
Forecasts presented in this section only reflect the author’s private opinion and should not be considered as guidance for trading. RoboForex bears no responsibility for trading results based on trading recommendations described in these analytical reviews.