Fibonacci Retracements Analysis 20.09.2017 (AUD/USD, USD/CAD)
AUD USD, “Australian Dollar vs US Dollar”
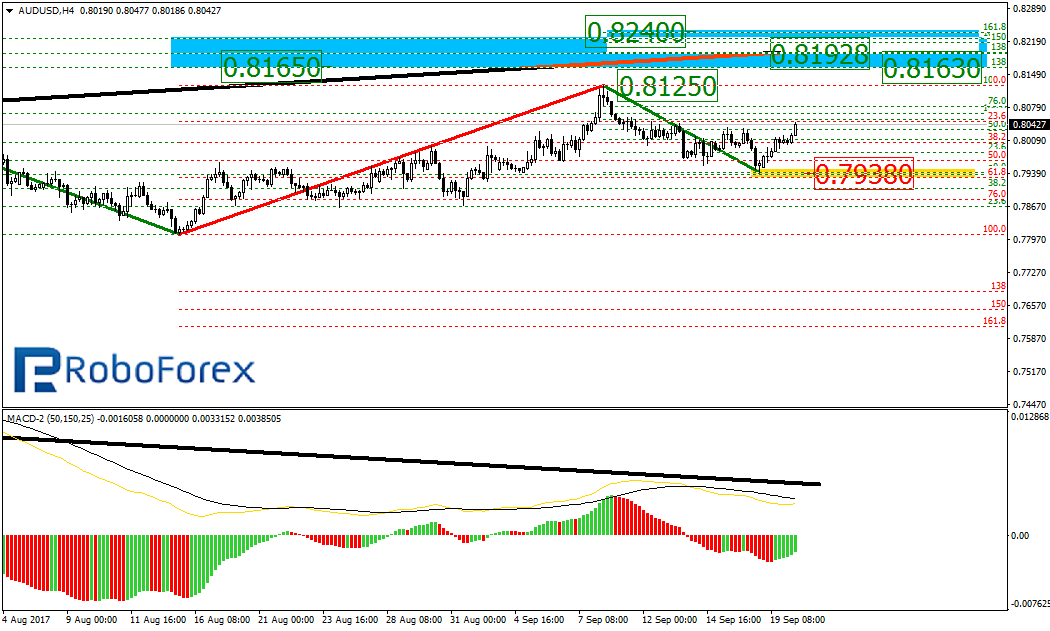
At the H4 chart, the AUD/USD pair is forming another ascending impulse. The short-term support is at 0.7938. The possible upside targets may be inside two the post-correctional extension areas between the retracements of 138.2% and 161.8%, the long term one – 0.8165 and 0.8225, the short-term one – 0.8192 and 0.8240 respectively.
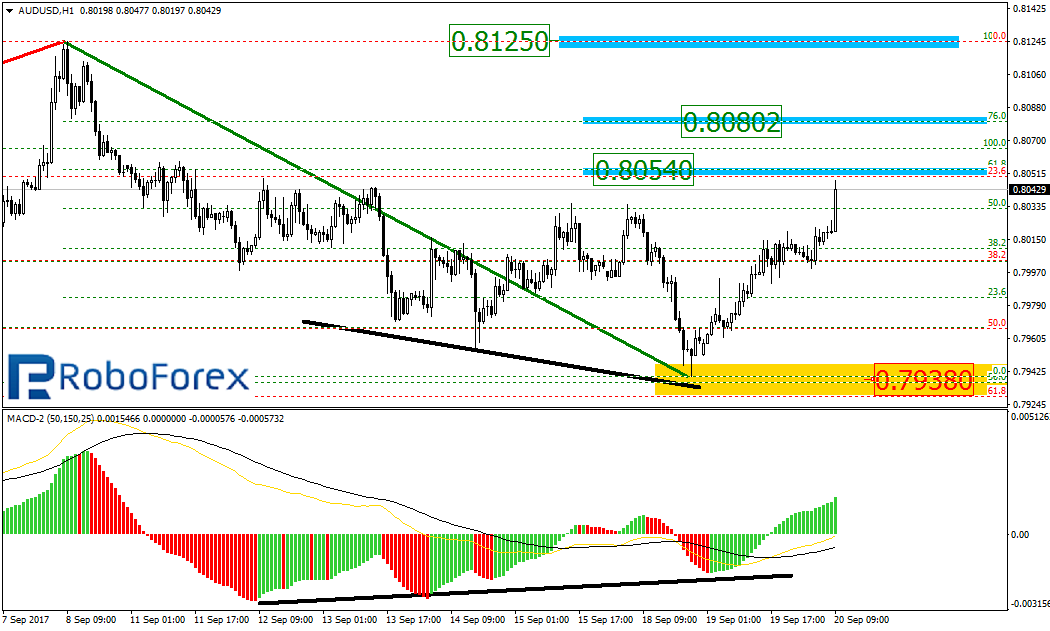
At the H1 chart, the pair is forming the convergence and about to finish its descending movement. The closest targets of the current growth are close to the retracements of 61.8% and 76.0% at 0.8054 and 0.8080 respectively, and the high at 0.8125.
USD/CAD, “US Dollar vs Canadian Dollar”
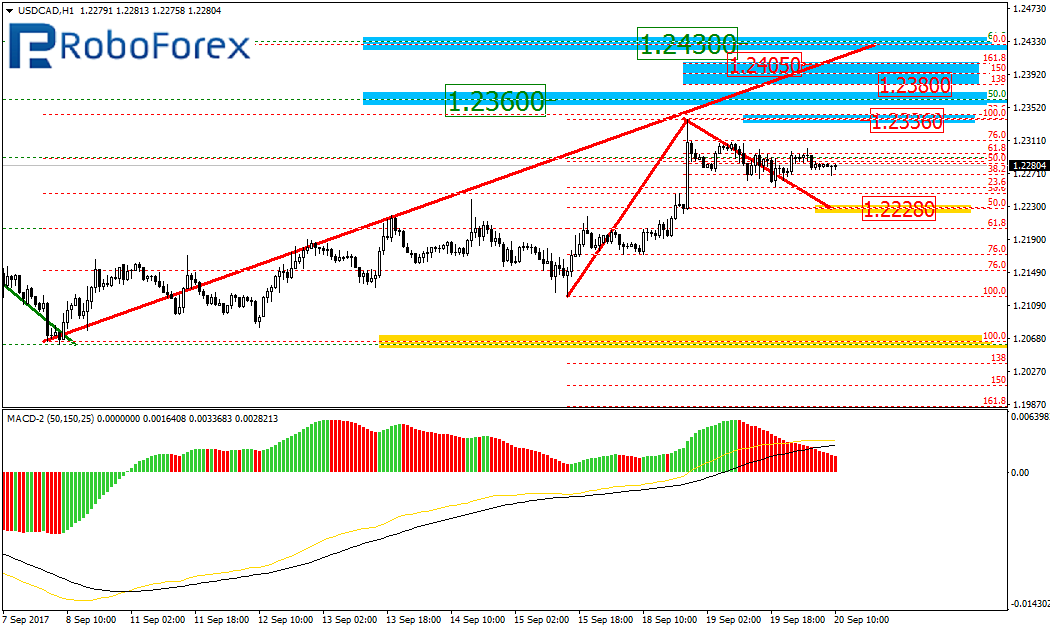
At the H4 chart, the USD/CAD pair is being corrected to the upside. The targets of this correction may be the retracements of 50.0% and 61.8% at 1.2360 and 1.2430 respectively. After finishing the correction, the price may resume falling to test the local low. If the pair breaks it, the instrument may fall towards the post-correctional extension area between the retracements of 138.2% and 161.8% at 1.1925 and 1.1835 respectively.

As we can see at the H1 chart, after completing the short-term ascending impulse, the pair is also being corrected to the downside. The main target of this correction may the retracement of 50.0% at 1.2228. After the correction is over, the uptrend may continue towards the area between 1.2380 and 1.2405.
RoboForex Analytical Department
Forecasts presented in this section only reflect the author’s private opinion and should not be considered as guidance for trading. RoboForex bears no responsibility for trading results based on trading recommendations described in these analytical reviews.