Fibonacci Rentracements Analysis 20.07.2017 (AUD/USD, USD/CAD)
AUD/USD
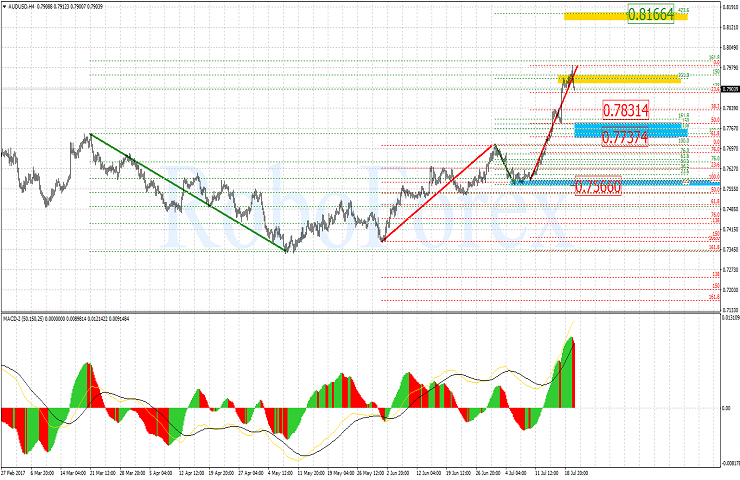
The H4-chart of AUD/USD shows continuation of the current uptrend. After a downside correction towards 0.7566 occured, an ascending impulse took place which went beyond the 261.8% Fibo elongation. In the short-term, a downward correction towards 38.2% Fibo level can be expected which corresponds to 0.7831 mark. Then the market can go to 50.0%, and after that it can hit 61.8% (0,7737 mark). After a correction of the ascending impulse is over, a new impulse can form within the prevailing tendency, and this will have 0.8166 mark as its target.
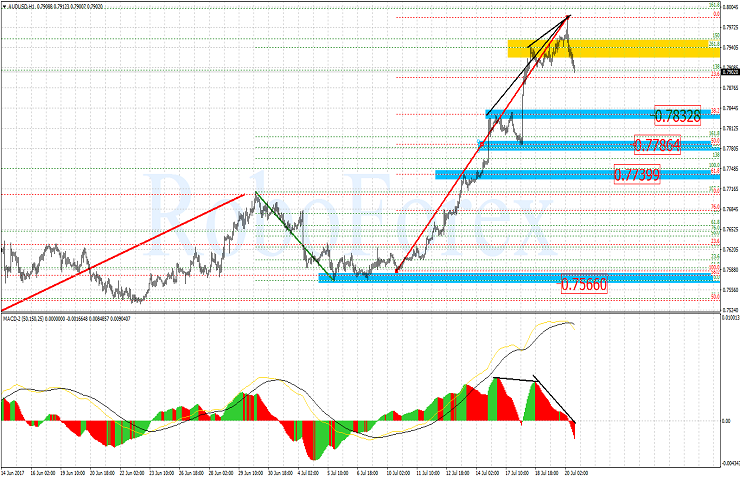
The H1-chart of AUD/USD pair shows a divergence being formed, and this in turn confirms a possible correction downward move. The 23.6% level has already been hit and the Fibo levels 38,2%, 50,0% and 61,8% (0.7832, 0.7786 and 0.7739 correspondingly) can be the next target areas for the current descending move.
USD/CAD
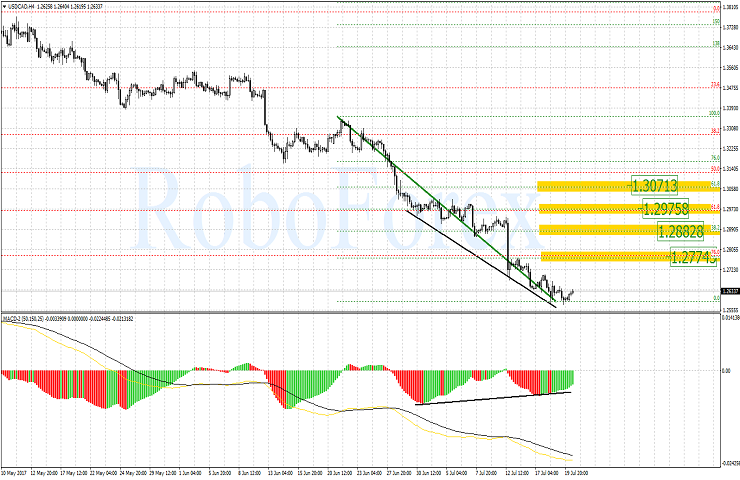
The H4-chart of USD/CAD pair shows a convergence being formed, and this can be a signal for a possible correction rise. The nearest target for this correction are 23.6% and 38.2% Fibo levels (1.2774 and 1.2882 marks correspondingly).
The H1-chart of USD/CAD pair has suggested a possible reversal convergence pattern. This convergence pattern may suggest a possible upward rebound starting at the last descending micro-impulse. Thus, the 23.6% level (1.2662) can be the nearest target for the correction upward move. The Fibo level 50.0% (1.2759) can be deemed the main target for this rise.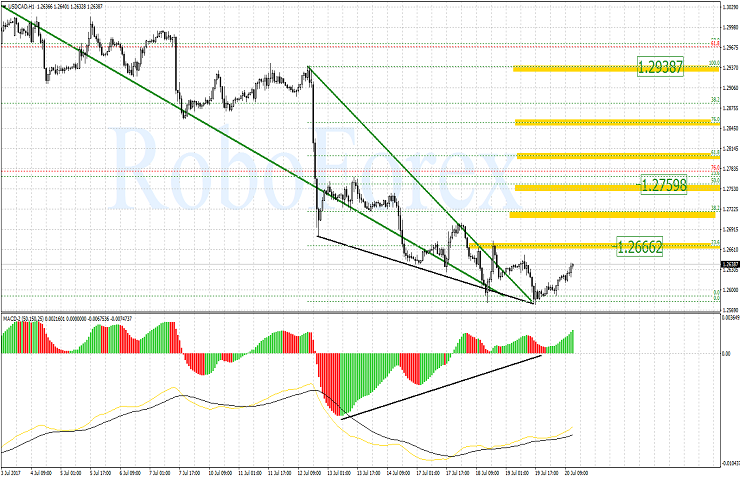
Forecasts presented in this section only reflect the author’s private opinion and should not be considered as guidance for trading. RoboForex bears no responsibility for trading results based on trading recommendations described in these analytical reviews.