Fibonacci Retracements Analysis 19.09.2017 (GBP/USD, EUR/JPY)
GBP USD, “Great Britain Pound vs US Dollar”
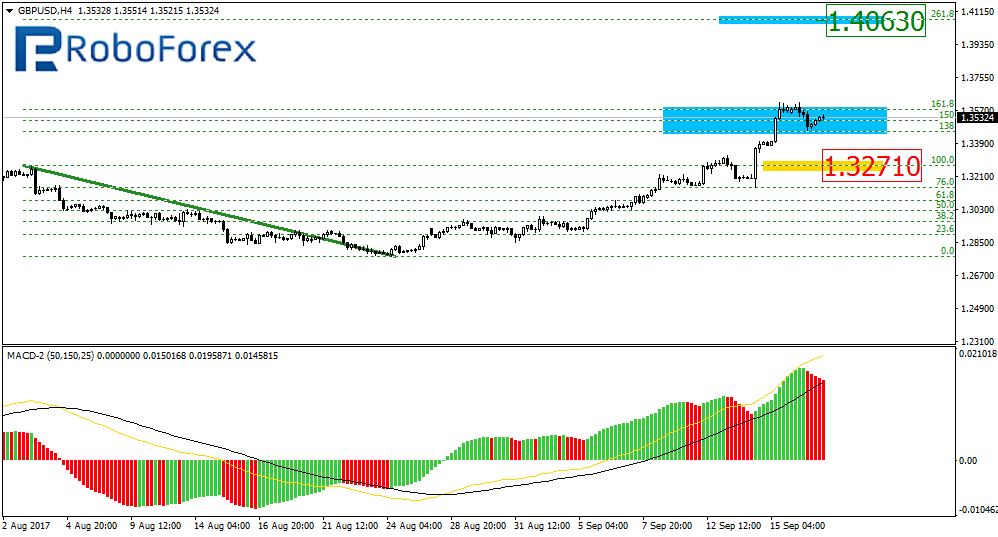
As we can see at the H4 chart, the GBP/USD pair has finished the ascending impulse towards the post-correctional extension area between the retracements of 138.2% and 161.8%. The next upside target may be the retracement of 261.8% at 1.4063.
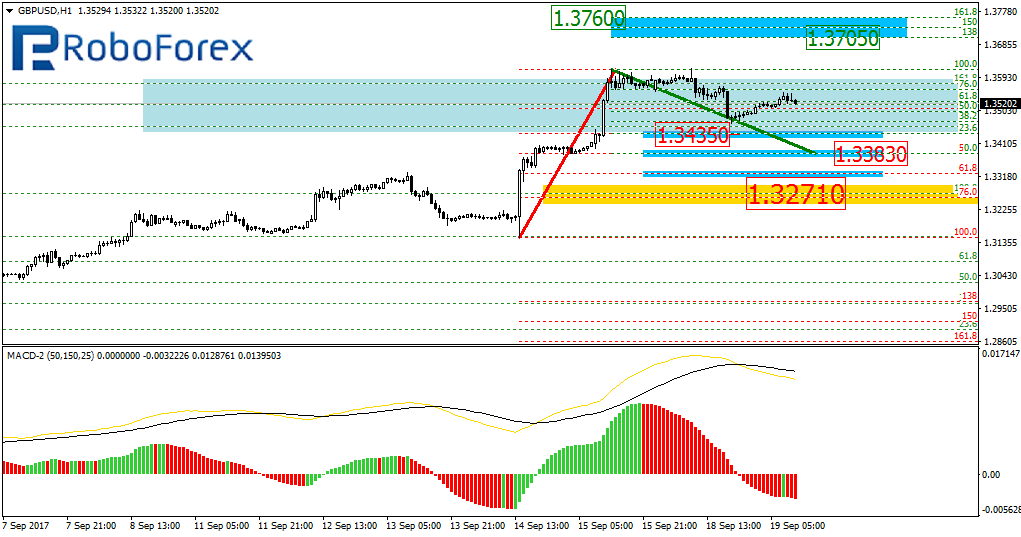
At the H1 chart, the previous ascending impulse has been corrected by 23.6%. The next targets of this correction may be the retracements of 38.2% and 50.0% at 1.3415 and 1.3383 respectively. The main support level of the current trend is at 1.3270. After completing the correction, the pair may resume growing towards the post-correctional extension area between the retracements of 138.2% and 161.8% at 1.3705 and 1.3760 respectively.
EUR JPY, “Euro vs. Japanese Yen”
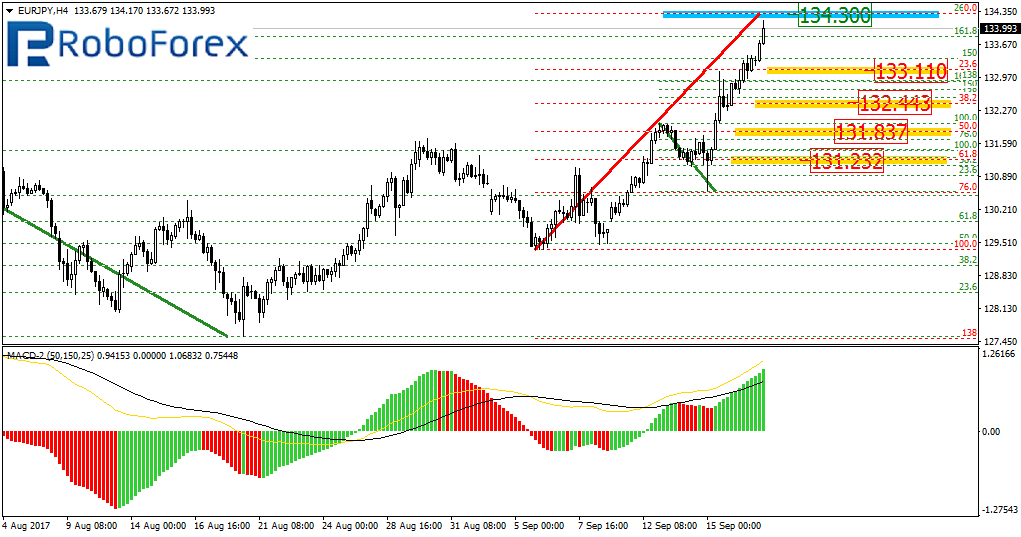
As we can see at the H4 chart, the pair has got close to the predicted upside target at the retracement of 261.8% at 134.30. After reaching this level, the price may be corrected to the downside towards the retracements of 23.6%, 38.2%, 50.0%, and 61.8% at 133.11, 132.44, 131.83, and 131.23 respectively.
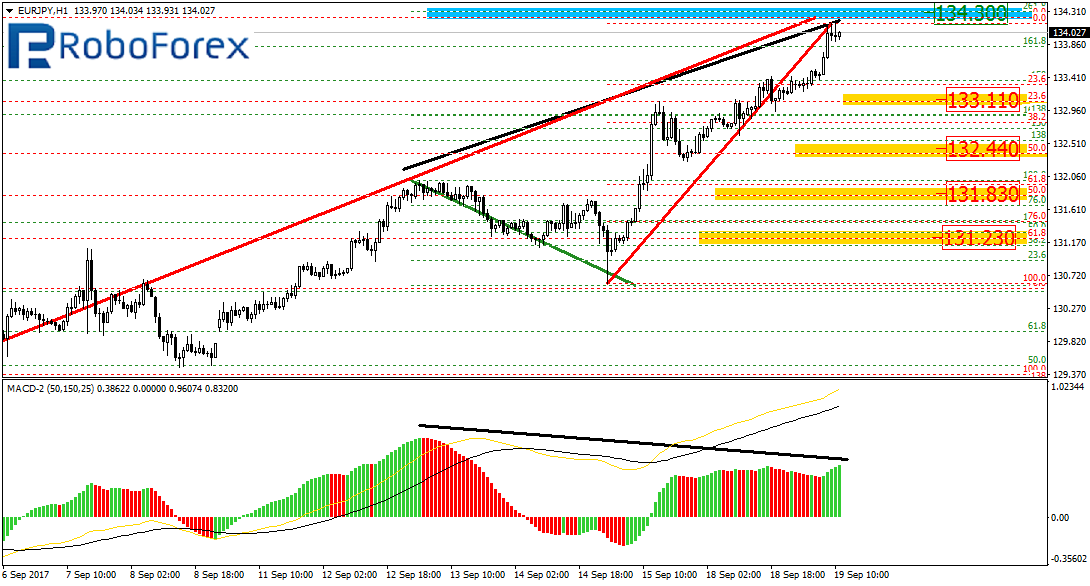
At the H1 chart, the pair is forming the divergence, which confirms the H4 chart scenario.
RoboForex Analytical Department
Forecasts presented in this section only reflect the author’s private opinion and should not be considered as guidance for trading. RoboForex bears no responsibility for trading results based on trading recommendations described in these analytical reviews.