Fibonacci Retracements Analysis 19.07.2017 (GBP/USD, EUR/JPY)
GBP/USD
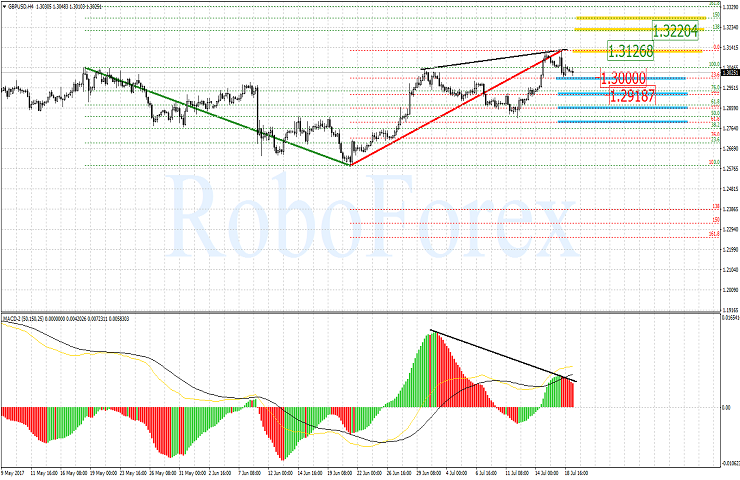
The H4-chart of GBP/USD suggests a reversal pattern - divergence. The downward move has already formed the previous ascending impulse 23.6% by Fibo. The levels 38,2%, 50,0% and 61,8% can serve as the next targets for the correction while the nearest target is 1.2918 mark (38.2% level). In case the current local high 1.3126 is broken through, the pair can rise towards 1.3220 which corresponds to 138.2% of the previous correction' elongation.
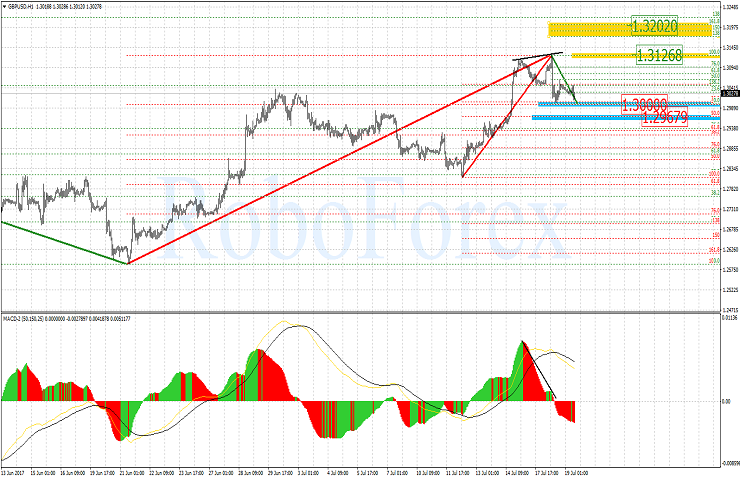
The divergence that has been formed on the H1-chart suggested a correction. The pair has corrected then by 38.2% (1,3000 mark). The 50.0% Fibo level (1.2967 mark) can become the next target for the correction move.
EUR/JPY
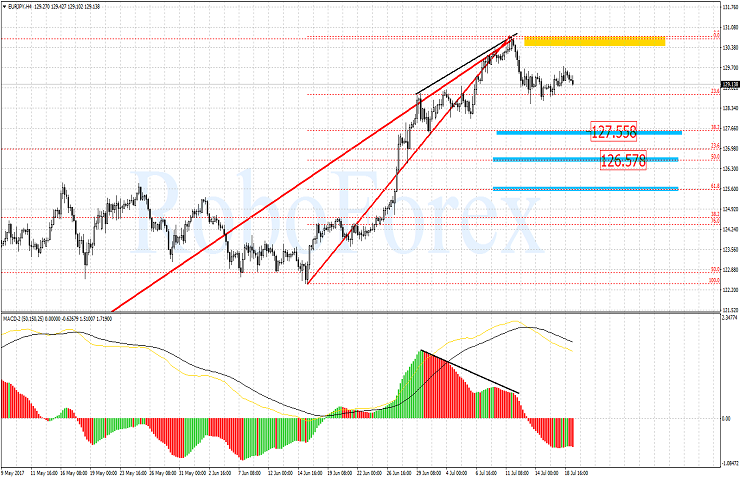
Looking at the H4 EUR/JPY,chart we can see the start of a correction downward move which was predicted by the divergence earlier. The pair has corrected by 23.6% and the Fibo levels 38.2% (127.55) and 50.0% (126.57) may serve as the next target for this correction. The resistance level stands at the local high.
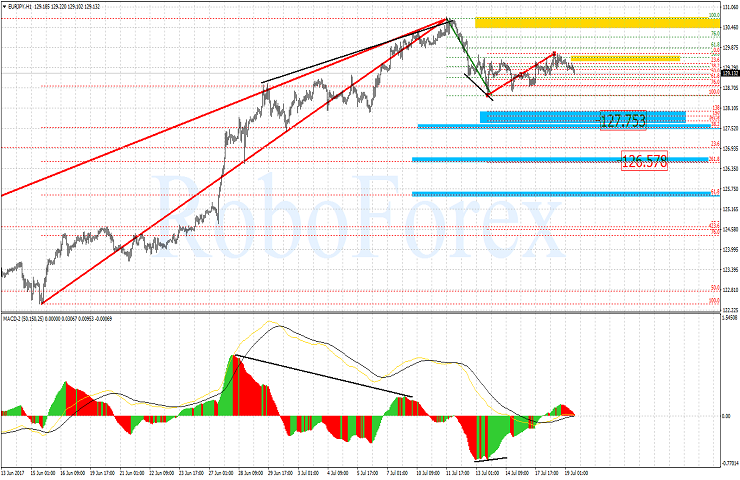
The H1 EUR/JPY chart confirms the view of the senior timeframe. The pair has started a consolidation range.
Forecasts presented in this section only reflect the author’s private opinion and should not be considered as guidance for trading. RoboForex bears no responsibility for trading results based on trading recommendations described in these analytical reviews.