Fibonacci Retracements Analysis 18.08.2017 (GOLD, USD/CHF)
XAU USD, “Gold vs US Dollar”
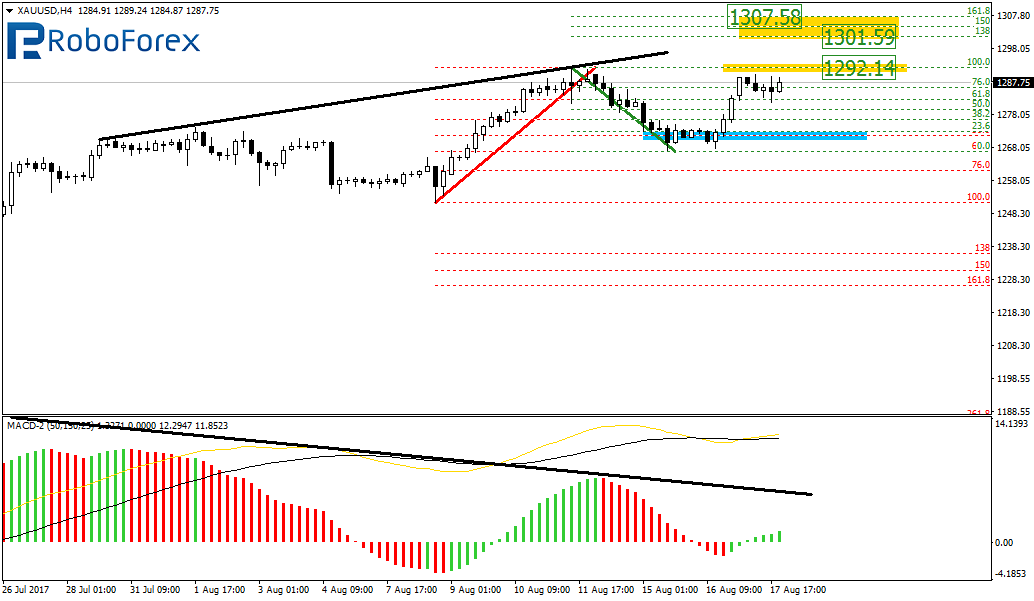
As we can see at the H4 chart, after being corrected to the downside by 50%, Gold is trying to resume the uptrend. After breaking the local high at 1292.14, the pair may move upwards to reach the post-correctional extension area between the retracements of 138.2% and 161.8% at 1301.59 and 1307.58 respectively.
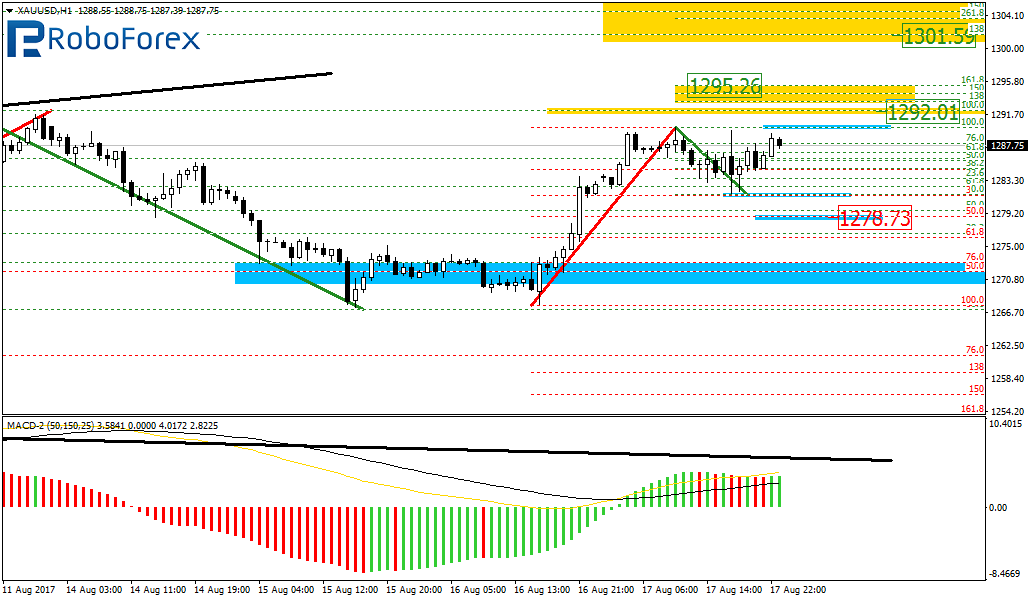
At the H1 chart, the situation is pretty similar.
USD CHF, “US Dollar vs Swiss Franc”
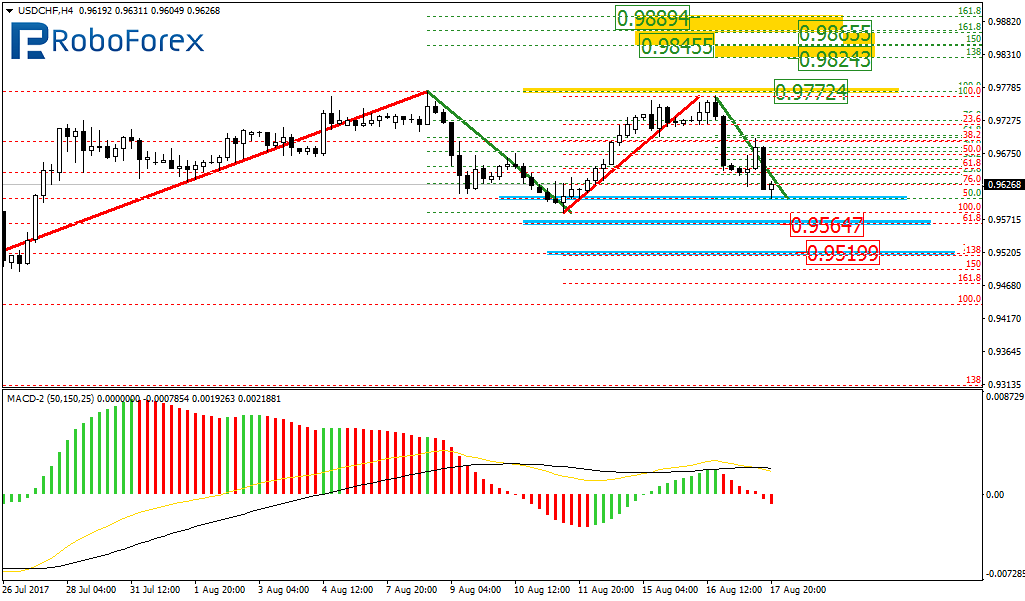
As we can see at the H4 chart, the USD/CHF pair is forming the sideways correction. After being corrected by 50.0%, the price tried to test the highs, but it seems that the market is going to continue the correction. The next targets of this correction may be the retracements of 61.8% and 76.0% at 0.9564 and 0.9519 respectively.
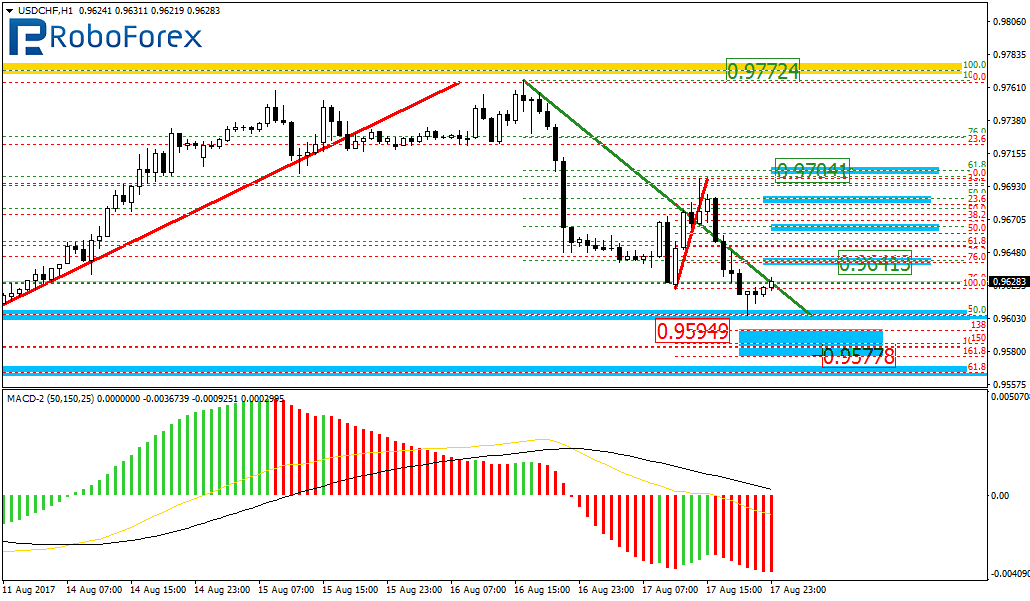
At the H1 chart, the local downtrend stopped and me be transforming into the sideways correction. The closest downside targets may be between 0.9594 and 0.9577.
RoboForex Analytical Department
Forecasts presented in this section only reflect the author’s private opinion and should not be considered as guidance for trading. RoboForex bears no responsibility for trading results based on trading recommendations described in these analytical reviews.