Japanese Candlesticks Analysis 24.04.2017 (EUR/USD, USD/JPY)
EUR USD, “Euro vs. US Dollar”
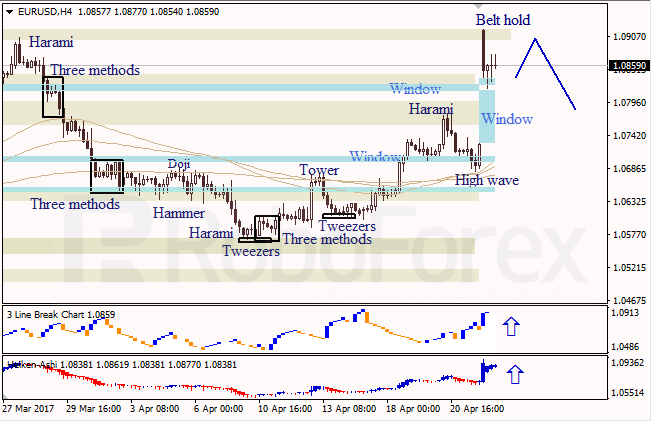
At the H4 chart of EUR USD, a new Window to the upside was opened. Bearish Belt Hold pattern indicates a descending movement. The upside Window is a support level. Three Line Break chart and Heiken Ashi candlesticks confirm a bullish direction.
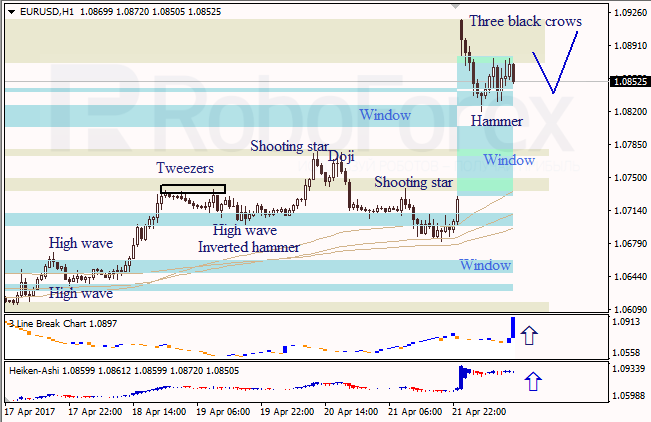
At the H1 chart of EUR USD, bearish Three Black Crows pattern shows a descending correction. The Window in the middle is a support level. Three Line Break chart and Heiken Ashi candlesticks confirm a bullish direction.
USD JPY, “US Dollar vs. Japanese Yen”
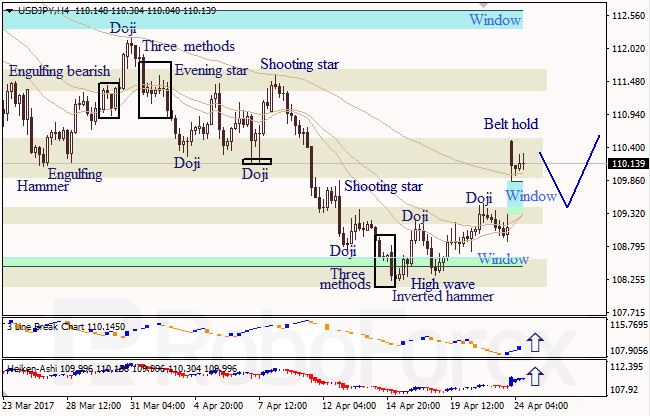
At the H4 chart of USD JPY, bearish Belt Hold pattern indicates a descending movement. The closest Window is a support level. Three Line Break chart and Heiken Ashi candlesticks confirm a bullish direction.
RoboForex Analytical Department
Forecasts presented in this section only reflect the author’s private opinion and should not be considered as guidance for trading. RoboForex bears no responsibility for trading results based on trading recommendations described in these analytical reviews.