Japanese Candlesticks Analysis 16.05.2017 (EUR/USD, USD/JPY)
EUR USD "Euro vs. USD"
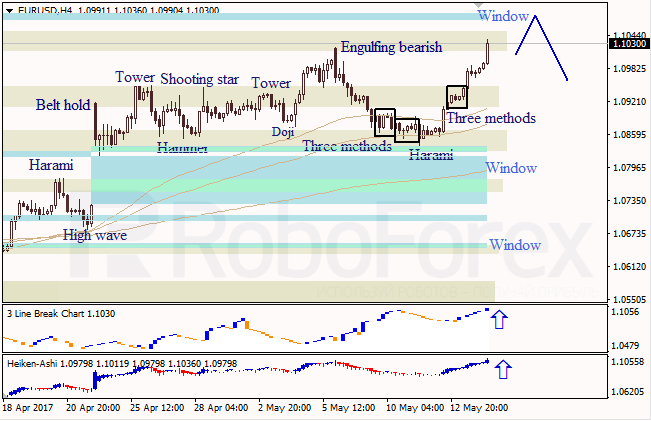
On the H4 chart of EUR USD the upper Window is a resistance while the bullish continuatioon pattern Three Methods shows upward direction. Three Line Break chart and Heiken Ashi candlesticks show a bullish tendency.
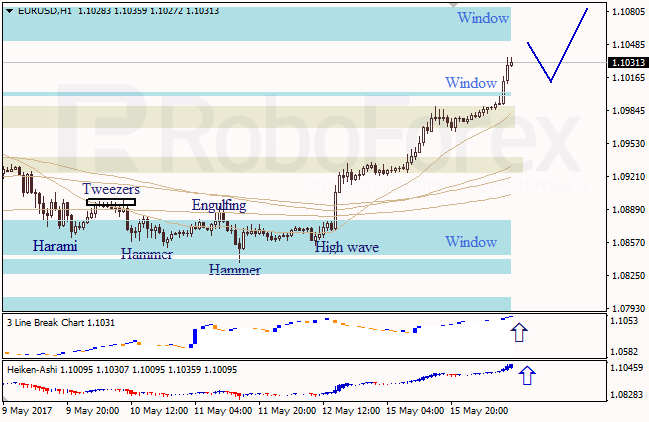
On the H1 chart of EUR USD chart there is a bullish tendency, no reversal patterns are there and bullish candlesticks are being formed. The Three Line Break chart and Heiken Ashi confirm the upward direction.
USD JPY "US Dollar vs. Japanese Yen"
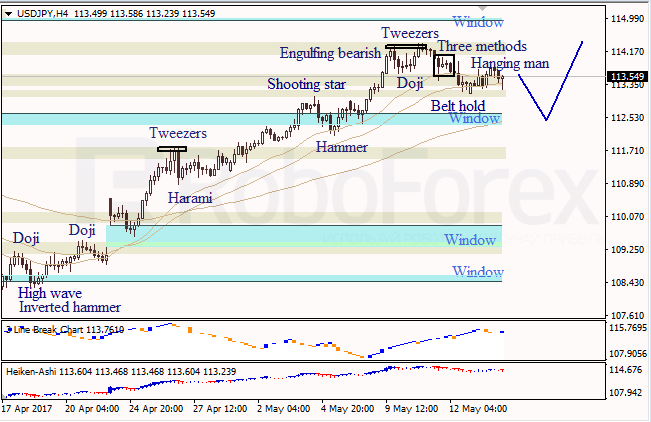
On the H4 chart of USD JPY there is a bearish pattern Hanging Man which shows a downward correction; the middle Window acts as a support. On the Three Line Break chart there is a bullish picture, Heiken Ashi candlesticks confirm a bearish pullback.
Forecasts presented in this section only reflect the author’s private opinion and should not be considered as guidance for trading. RoboForex bears no responsibility for trading results based on trading recommendations described in these analytical reviews.