Wave Analysis 25.03.2013 (EUR/USD, GBP/USD, USD/CHF, USD/JPY)
25.03.2013
Analysis for March 25th, 2013
EUR/USD
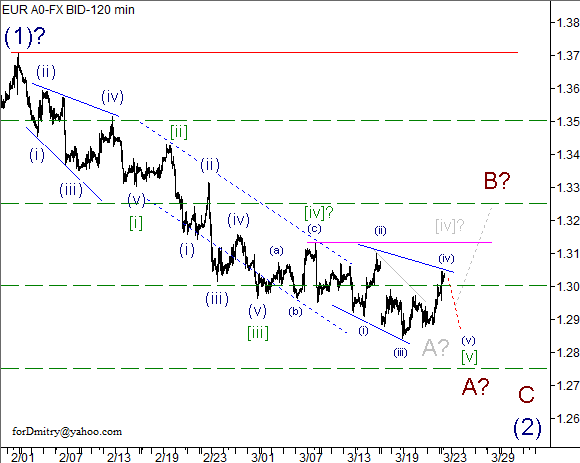
We can’t exclude a possibility that a descending correction (2) of [C] is taking the form of zigzag.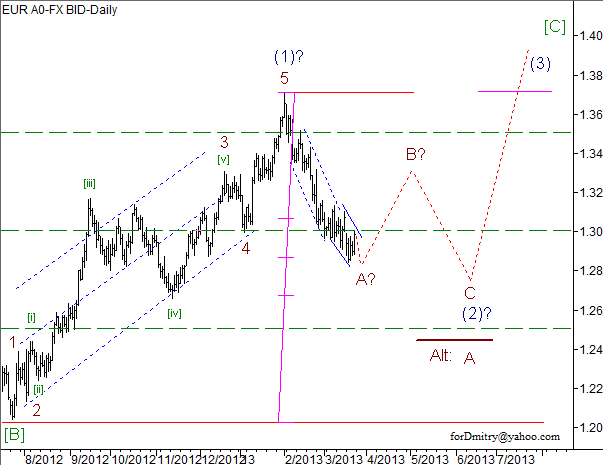
We can’t exclude a possibility that the price is finishing (or finished) diagonal triangle[v] of A of a descending impulse A.
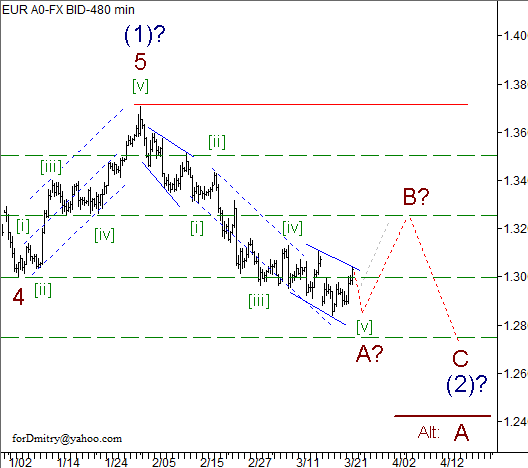
Currently there are several possible scenarios how a descending impulse A of (2) may be finished. Right now it better to wait for a while until the chart structure becomes clearer.
GBP/USD
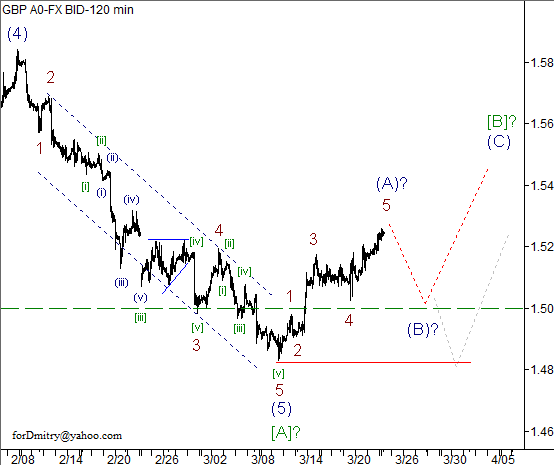
Pound is completing a descending diagonal triangle(c) of [b].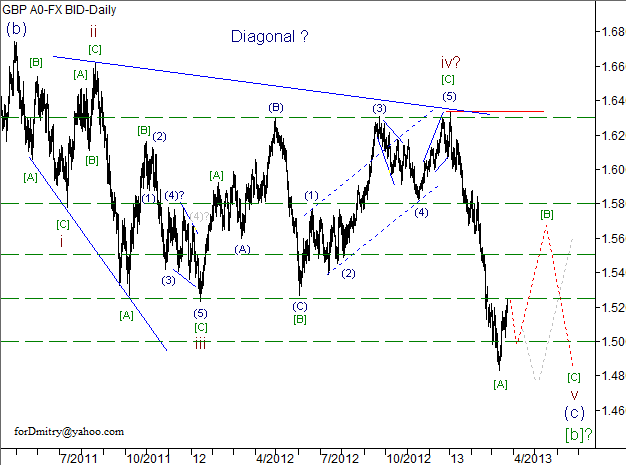
We can’t exclude a possibility that the price is forming an ascending zigzag[B] of v, which may be followed by a local descending correction (B) of [B] of v.
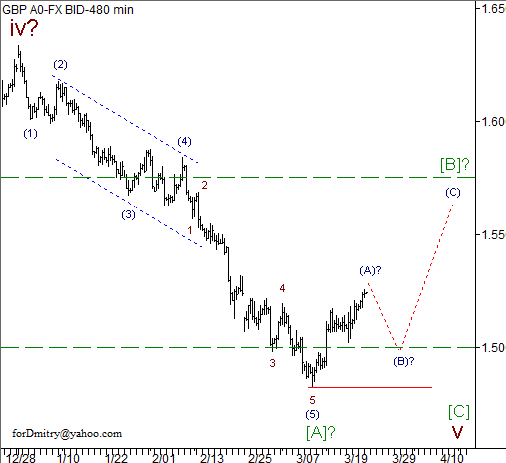
We may assume that a local ascending correction [B] of v may take the form of zigzag.
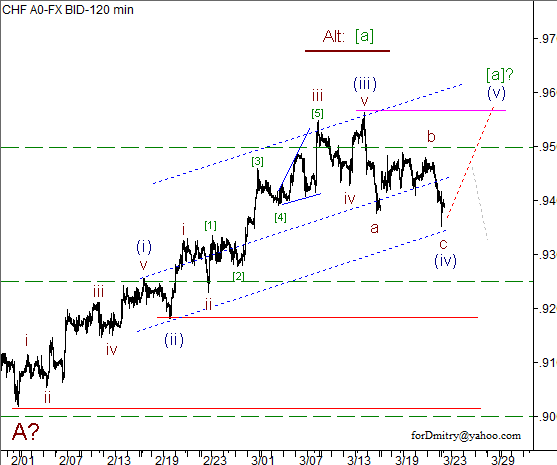
USD/CHF
We can’t exclude a possibility that Franc is forming a local ascending or horizontal correction B of (5), which may be followed by a descending wave C of (5).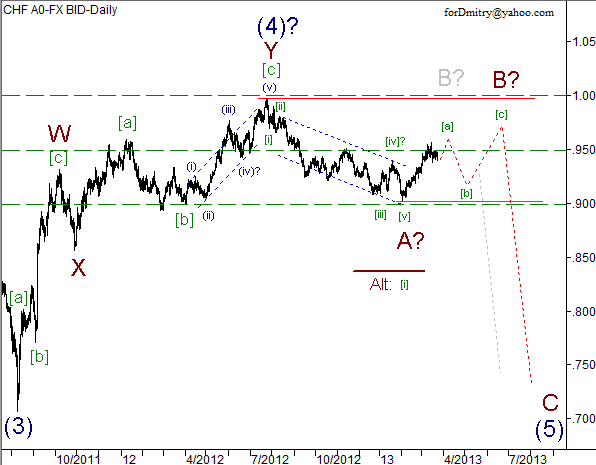
We may assume that the price is finishing an ascending impulse [a] of B, which may be followed by a local descending correction (b) of B.
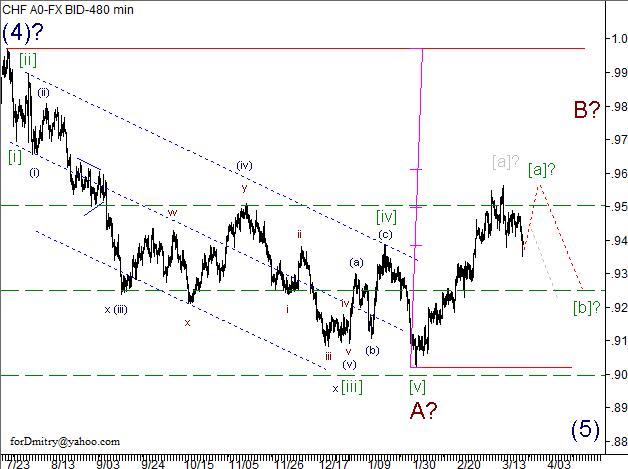
We can’t exclude a possibility that that the price is completing an ascending impulse [a].
USD/JPY
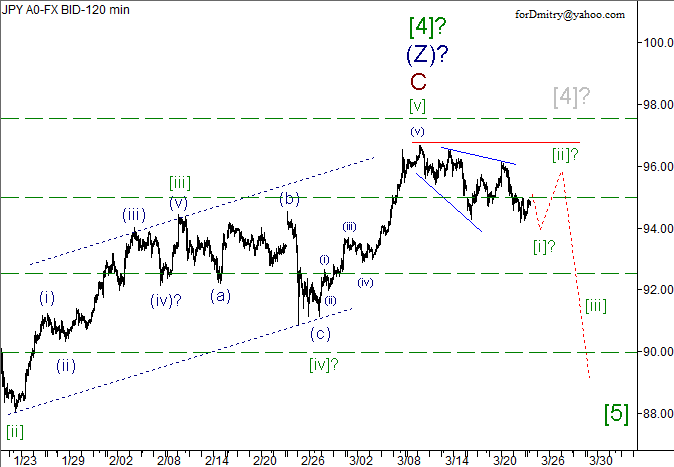
One of the possible scenarios implies that the pair is forming a descending wave [5] of V or making a deep pullback, at least. The depth of the expected descending movement may help us to define a future scenario.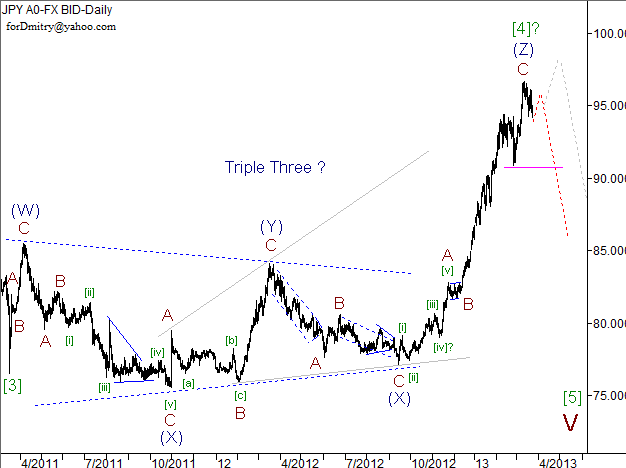
The chart structure implies that the pair completed an ascending zigzag(Z) of [4] and a large correction [4]. However, this assumption has yet to be confirmed.
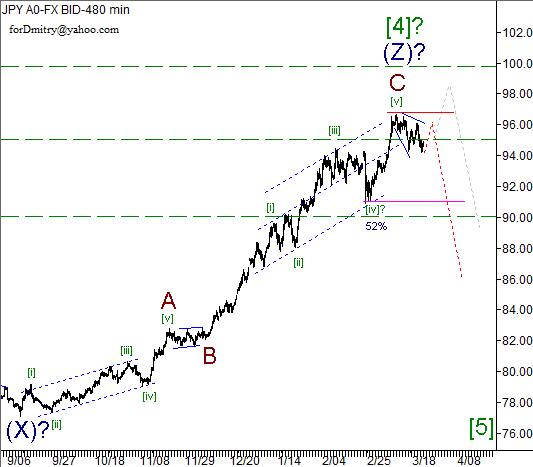
We may assume that that the price finished an ascending impulse C of(Z) of [4] and started a new descending trend inside wave [5]
RoboForex Analytical Department
Attention!
Forecasts presented in this section only reflect the author’s private opinion and should not be considered as guidance for trading. RoboForex bears no responsibility for trading results based on trading recommendations described in these analytical reviews.