Monthly Wave Analysis for March, 2013 (EUR/USD, GBP/USD, USD/CHF, USD/JPY)
04.03.2013
Analysis for March, 2013
EUR/USD
We may assume that the first part, wave [A], was completed in the form of a fast ascending impulse; a correction [B] was finished in the form of almost horizontal triple three. In this assumption is correct, then right now the price is forming the second ascending part, wave [C], which may take the form of an impulse or diagonal triangle.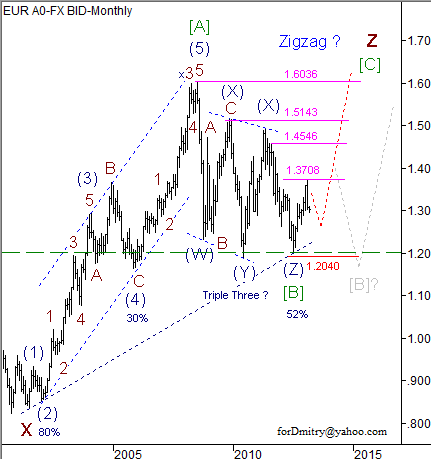
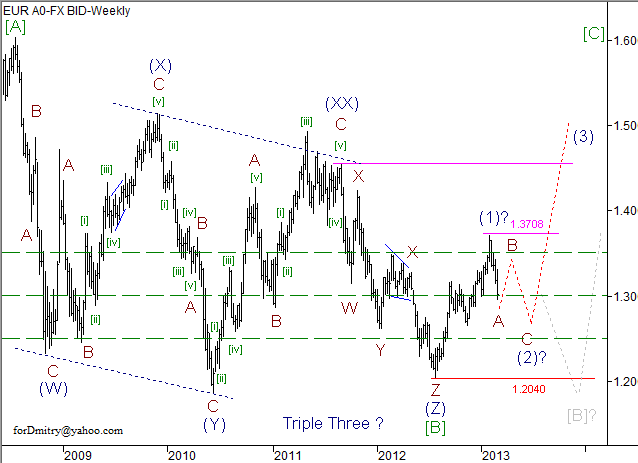
The chart structure implies that the second part of an ascending zigzagz, wave [C] of z, may take the form of an impulse. If it’s true, then currently the price is forming a local descending correction (2) of [C], the form of which is not quite clear yet. In this case the pair is expected to make a reverse near the level of 1.25 without breaking the critical level of 1.2040 and continue growing up.
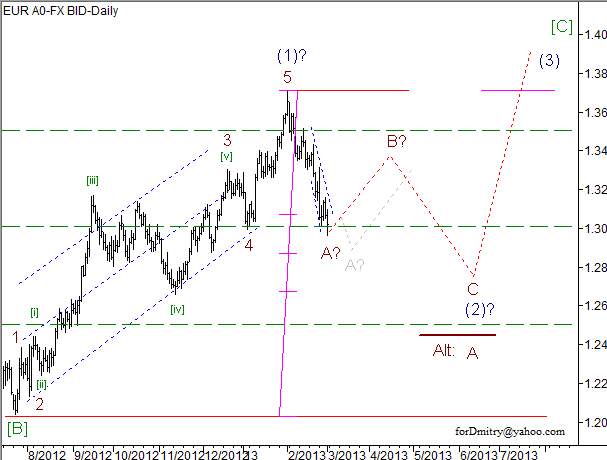
We may assume that the price is forming a descending correction (2) of [C], which may be followed by a new ascending wave (3) of [C].
GBP/USD
We can’t exclude a possibility that the price is forming divergent horizontal triangle[X] of x, a final wave of which, a descending zigzagA-B-C of (E) of [X] of x, probably hasn’t been completed yet.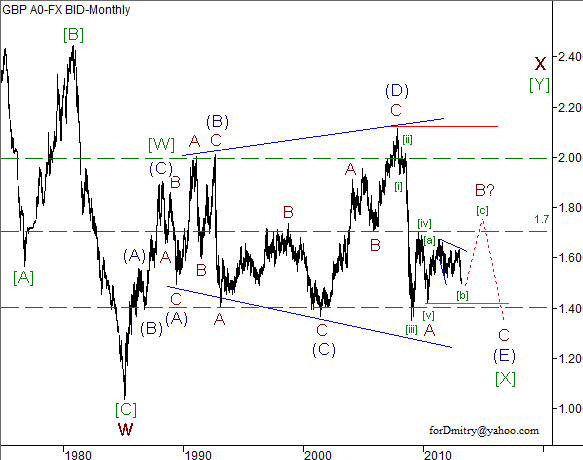
The main scenario (but not the only one) implies that an ascending correction B of (E) is taking the form of zigzag. If the assumption is correct, then currently the pair is completing a correction [b] of B of (E), which may be followed by an ascending wave [c] of B of (E) towards the level of near 1.7 or a bit higher.
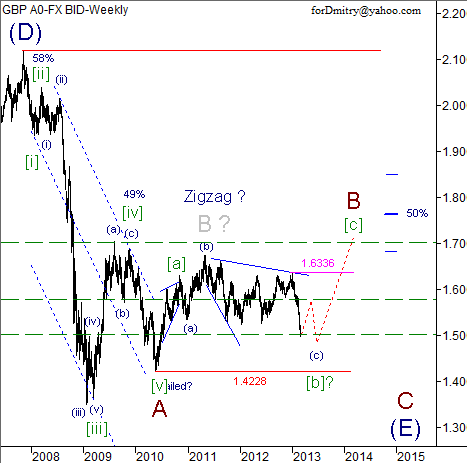
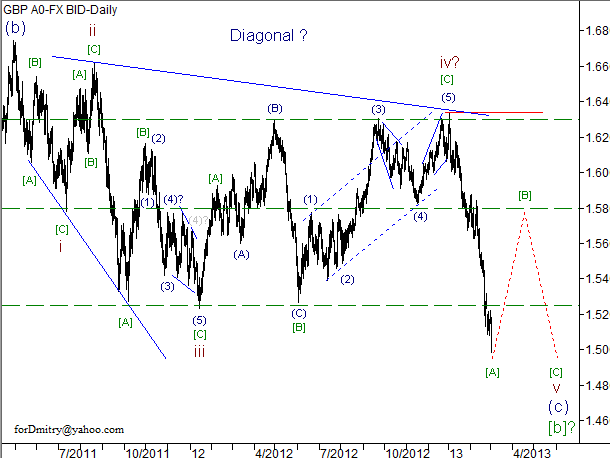
We may assume that a large descending correction [b] of B hasn’t been finished yet. If this assumption is correct, then the pair has to form a final zigzagv of (c) of [b] in order to complete it.
USD/CHF
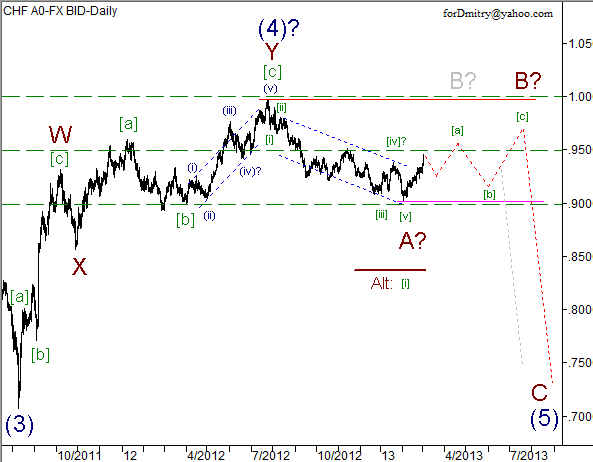
We may assume that Swiss Franc finished a final zigzagz of (a), which means that the price has almost completed a global descending structure in the form of triple zigzag or a descending wedge(a).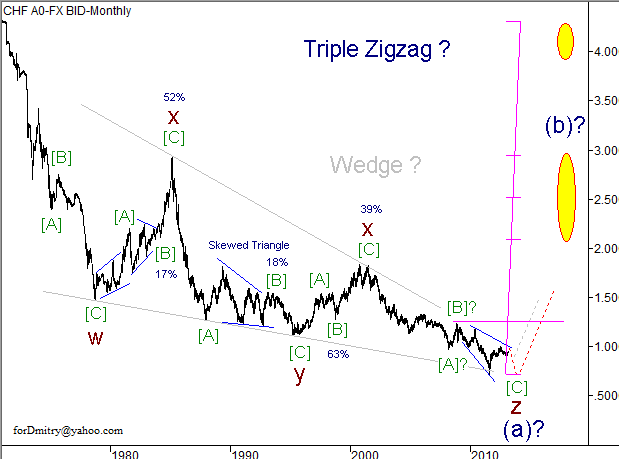
One of the possible scenarios implies that the second part of zigzagz, wave [C] of z, is taking the form of a large descending diagonal triangle, which lacks a final wave (5) of [C] of z in order to be completed. At the same time, one should take into account that currency interventions on the part of Swiss National Bank may change chart structure a lot.
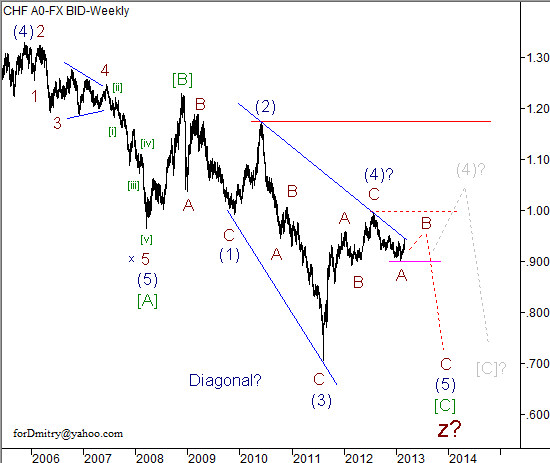
We may assume that the price completed a descending impulse A of (5) and started forming an ascending correction B of (5) which may be followed by a descending wave C of (5).
USD/JPY
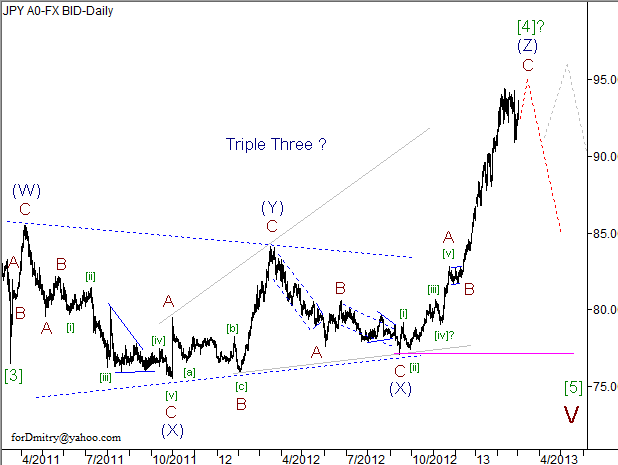
The USD/JPY currency pair is making a significant descending movement, which may be either an impulse or double zigzag. In both cases, the patterns are almost completed, which means that the price may make a reverse to start a new ascending trend.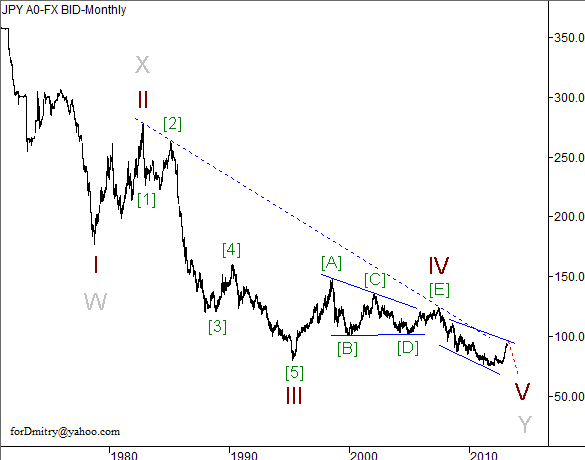
The main scenario implies that the price has almost finished a correction [4] ofV in the form of triple three. If this assumption is correct, the pair is expected to make a reverse downwards and start wave forming [5] of V without reaching the critical level.
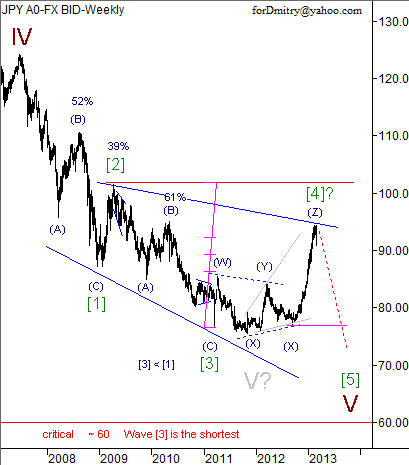
We can’t exclude a possibility that the price is completing an ascending zigzag(Z) of [4] of a correction [4]. If the assumption is correct, after that the pair is expected to make a reverse and start moving downwards inside wave [5] of V.
RoboForex Analytical Department
Attention!
Forecasts presented in this section only reflect the author’s private opinion and should not be considered as guidance for trading. RoboForex bears no responsibility for trading results based on trading recommendations described in these analytical reviews.