At the crossroads. XAU/USD wave analysis
12.09.2014
Analysis for September 12th, 2014
In our previous review, “The beginning of the uptrend. Wave analysis of XAU/USD for 09.09.2014”, we discussed a possible scenario how the price may start an ascending wave [C] of e of (iv).
Our assumption about the start of an ascending wave [C] of e of (iv) hasn’t been confirmed and the price chosen another scenario by breaking the shape of a possible triangle(iv), thus forcing us to change the chart structure.
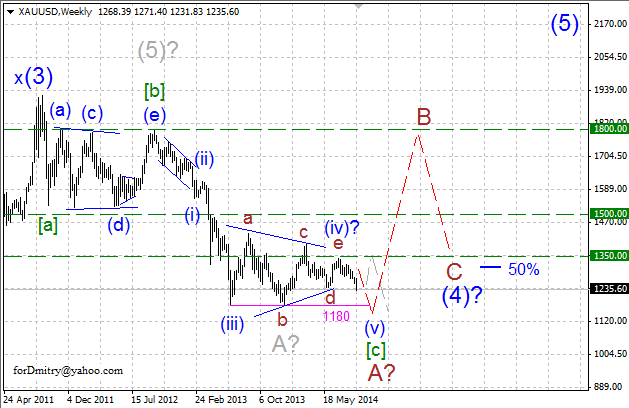
Our long-tern expectations haven’t changed so far – the pair is finishing impulse [a] of A and the whole large descending zigzag[a]-[b]-[c] of A of (4).
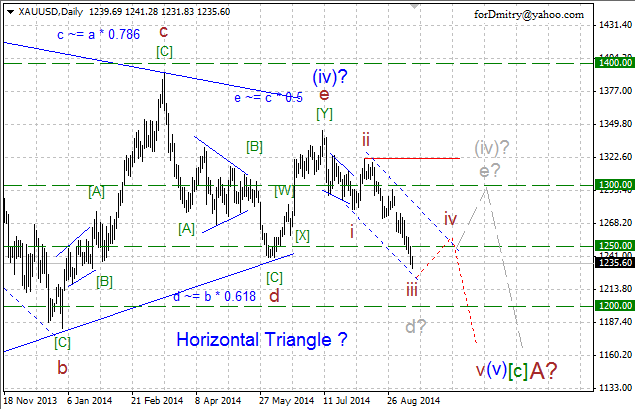
However, we may assume that a possible triangle(iv) of [c] of A has been already completed or is getting bigger that we expected earlier.
In the former case, the market may be finishing a descending impulse iii of (v) of [c] of the final impulse (v) of [c]. If it’s true, then the price is expected to form a slight ascending correction iv of (v) towards level of ~1250, after which it may continue falling inside the final wave v of (v).
An alternative scenario (colored in grey) implies that the pair is finishing a descending double zigzagd of (iv) of [c] of a large triangle(iv) of [c]. If the price chooses to continue this scenario, the market is expected to form a large ascending zigzage of (iv) towards level of ~1300.
However, at the same time one should remember that any possible scenario is subjective and the market may move in a completely different direction.
RoboForex Analytical Department
Attention!
Forecasts presented in this section only reflect the author’s private opinion and should not be considered as guidance for trading. RoboForex bears no responsibility for trading results based on trading recommendations described in these analytical reviews.