Descending pause on the way up. USD/CAD wave analysis
02.09.2014
Analysis for September 2nd, 2014
In our previous review, “Inside horizontal correction. Wave analysis of USD/CAD for 26.08.2014”, we discussed in details one of the possible scenarios how the price may continue moving.
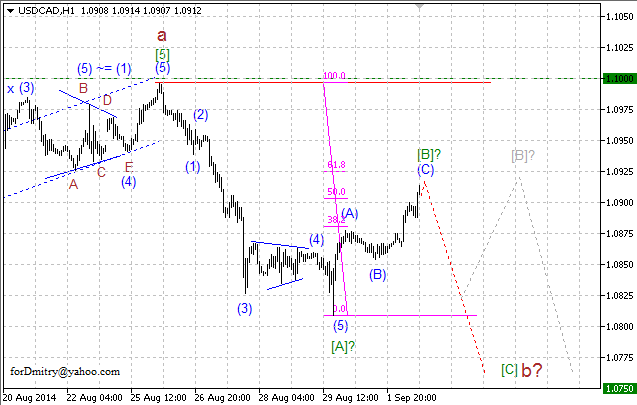
The pair continues forming a possible descending correction b of (b), which may take the form of zigzag and reach level of ~1.0750. Right now, the price is completing a local ascending zigzag[B] of b, after which the market may continue falling inside an impulse or diagonal triangle[C] of b.
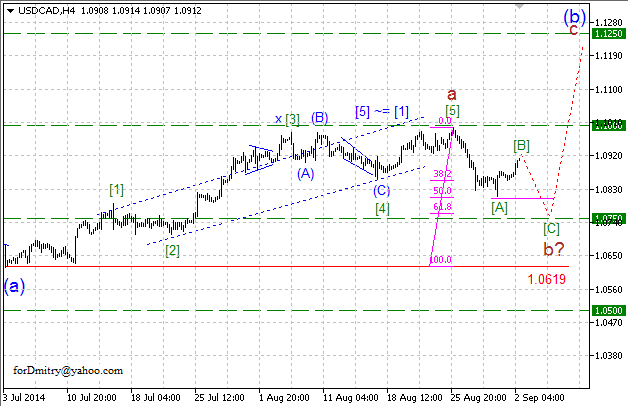
The wave structure on H4 chart implies that right now the market is forming a local correction b of (b) of a large ascending zigzag(b), after which the uptrend may continue inside an ascending wave c of (b). The critical level for this scenario is at 1.0619.
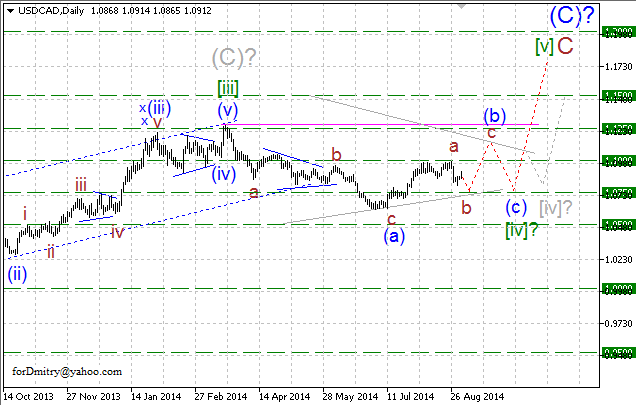
Our mid-term expectations haven’t changed much. The market continues forming a horizontal correction [iv] of C, which may take the form of flat or a long horizontal pattern. Right now, the pair is forming an ascending zigzag(b) of [iv].
However, at the same time one should remember that any possible scenario is subjective and the market may move in a completely different direction.
RoboForex Analytical Department
Attention!
Forecasts presented in this section only reflect the author’s private opinion and should not be considered as guidance for trading. RoboForex bears no responsibility for trading results based on trading recommendations described in these analytical reviews.