Impulse instead of zigzag. AUD/USD wave analysis
27.08.2014
Analysis for August 27th, 2014
In our previous review, “Up again. Wave analysis of AUD/USD for 22.08.2014”, we discussed several main scenarios how the price may continue a descending correction B.
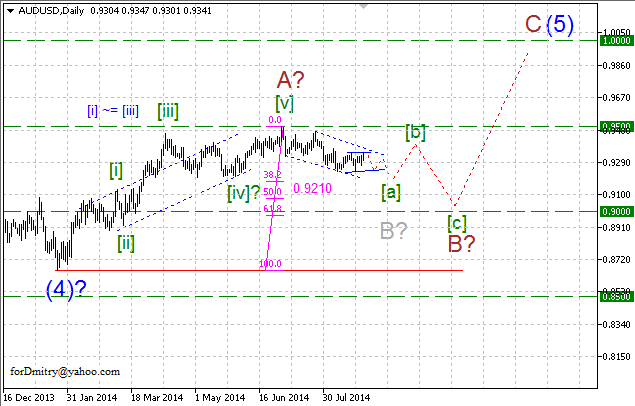
Our mid-term expectations haven’t changed so far – if our assumption is correct, then right now the price is still forming a descending correction B of (5), which may continue for several months. Possibly, this correction may take the form of a large zigzag; right now, the pair is forming its first “leg”, a descending impulse [a] of B.
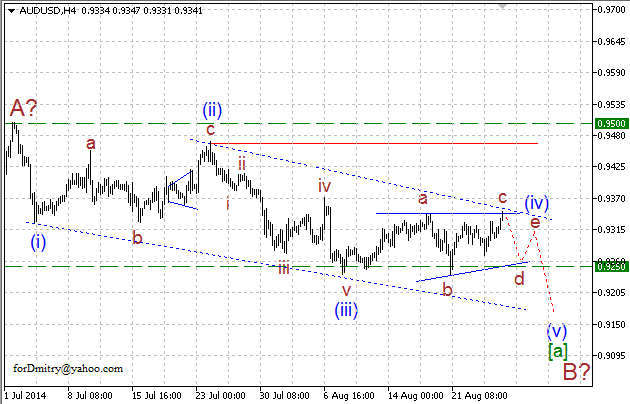
A possible scenario on the H4 chart is shown on the figure above. If our assumption about a descending impulse [a] of B is correct, then the price is forming its horizontal correction (iv) of [a] in the form of a long horizontal pattern. Right now, the pair is expected to form a descending zigzagd of (iv) of [a] inside this pattern.
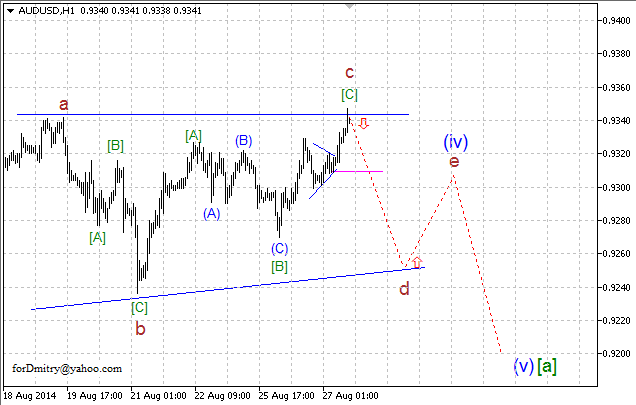
As we can clearly see at the H1 chart, an ascending zigzagc of (iv) of [a] has changed the shape of horizontal triangle a little bit, but not the nature of a horizontal correction (iv) of [a] and our short-term expectations. Possibly, the market started forming a descending zigzagd of (iv) of [a].
However, at the same time one should remember that any possible scenario is subjective and the market may move in a completely different direction.
RoboForex Analytical Department
In our previous review, “Up again. Wave analysis of AUD/USD for 22.08.2014”, we discussed several main scenarios how the price may continue a descending correction B.
Our mid-term expectations haven’t changed so far – if our assumption is correct, then right now the price is still forming a descending correction B of (5), which may continue for several months. Possibly, this correction may take the form of a large zigzag; right now, the pair is forming its first “leg”, a descending impulse [a] of B.
A possible scenario on the H4 chart is shown on the figure above. If our assumption about a descending impulse [a] of B is correct, then the price is forming its horizontal correction (iv) of [a] in the form of a long horizontal pattern. Right now, the pair is expected to form a descending zigzagd of (iv) of [a] inside this pattern.
As we can clearly see at the H1 chart, an ascending zigzagc of (iv) of [a] has changed the shape of horizontal triangle a little bit, but not the nature of a horizontal correction (iv) of [a] and our short-term expectations. Possibly, the market started forming a descending zigzagd of (iv) of [a].
However, at the same time one should remember that any possible scenario is subjective and the market may move in a completely different direction.
RoboForex Analytical Department
Attention!
Forecasts presented in this section only reflect the author’s private opinion and should not be considered as guidance for trading. RoboForex bears no responsibility for trading results based on trading recommendations described in these analytical reviews.