Up again. AUD/USD wave analysis
22.08.2014
Analysis for August 22nd, 2014
In our previous review, “Farewell to alternative? Wave analysis of AUD/USD for 13.08.2014”, we discussed several different scenarios how the price may continue a descending correction B.
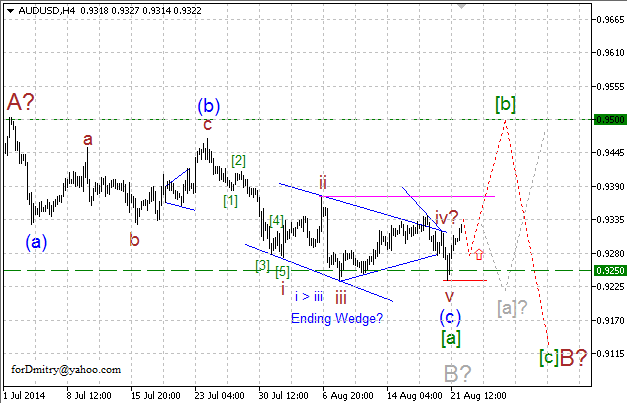
A possible scenario on H4 chart is shown on the figure above. Possibly, a descending correction B may take the form of flat[a]-[b]-[c] of B (or double zigzag / long pattern). If this assumption is correct, then by now the market has already completed a descending zigzag[a] of B in the predicted area, which may be followed by an ascending zigzag[b] of B.
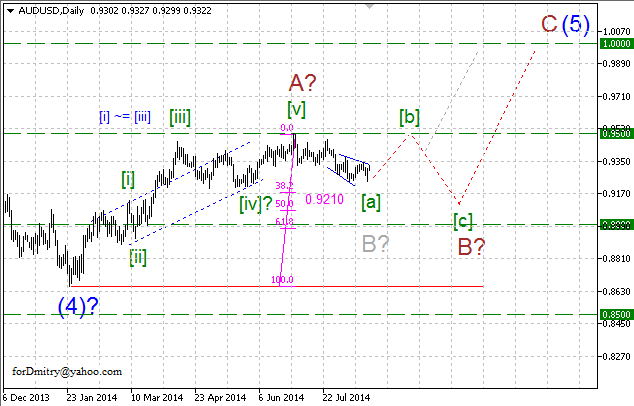
Our mid-term expectations haven’t changed so far – if our assumption is correct, then right now the price is forming a descending correction B of (5), which may continue for several months. The pair completed the first wave of this correction, [a] of B and the uptrend starts dominating.
However, at the same time one should remember that any possible scenario is subjective and the market may move in a completely different direction.
RoboForex Analytical Department
Attention!
Forecasts presented in this section only reflect the author’s private opinion and should not be considered as guidance for trading. RoboForex bears no responsibility for trading results based on trading recommendations described in these analytical reviews.