Wave Analysis 30.07.2014 (DJIA Index, Crude Oil)
30.07.2014
Analysis for July 30th, 2014
DJIA Index
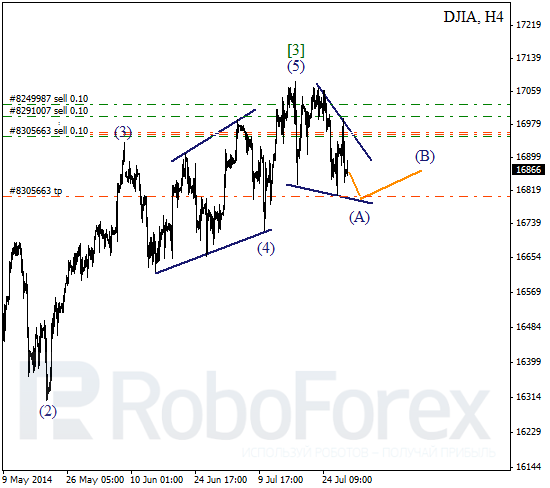
After completing wave (5) of [3], price is forming descending wave (A) in a form of wedge. Consequently, if price rebounds from lower pattern border, it may start larger correction.
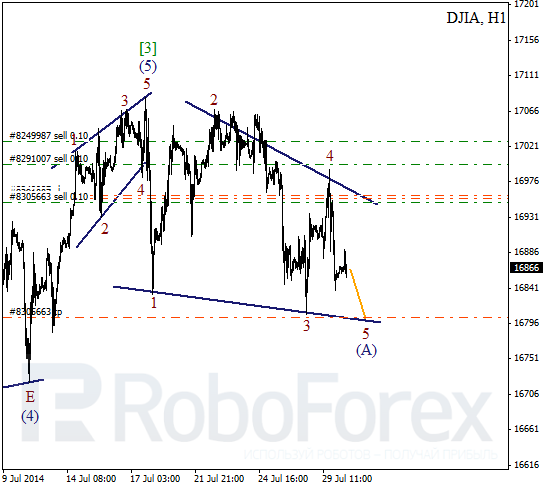
As we can see at H1 chart, yesterday price formed zigzag inside wave 4 and started descending movement inside the fifth wave. If price breaks wedge, extension in the third wave may become possible.
Crude Oil
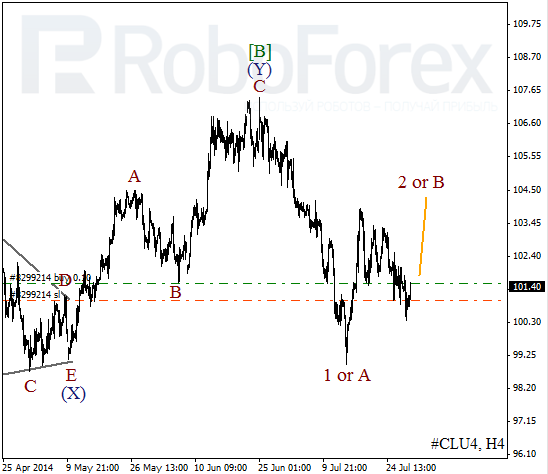
Oil is still being corrected. Probably, bullish impulse is being formed inside wave 2 or B. In the near term, price may reach new local maximum.
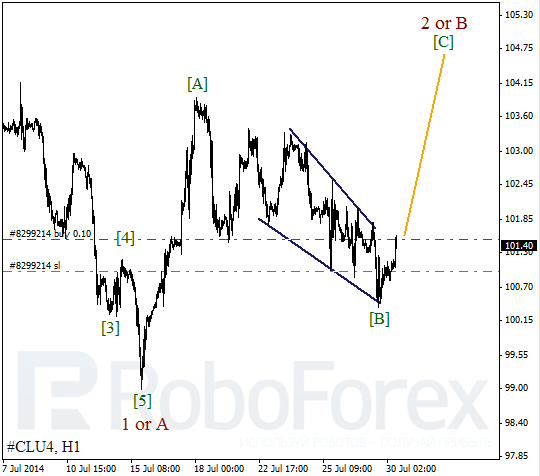
More detailed wave structure is shown at H4 chart. Probably, wave [B] was completed by diagonal triangle. I have only one buy order with stop loss under the last minimum.
RoboForex Analytical Department
Attention!
Forecasts presented in this section only reflect the author’s private opinion and should not be considered as guidance for trading. RoboForex bears no responsibility for trading results based on trading recommendations described in these analytical reviews.