Wave Analysis 25.07.2014 (DJIA Index, Crude Oil)
25.07.2014
Analysis for July 25th, 2014
DJIA Index
Current chart structure implies that Index is making a reverse downwards. It looks like after completing horizontal triangle pattern inside wave (4), price formed the fifth one. Possibly, during Friday market may fall down very fast towards its lows.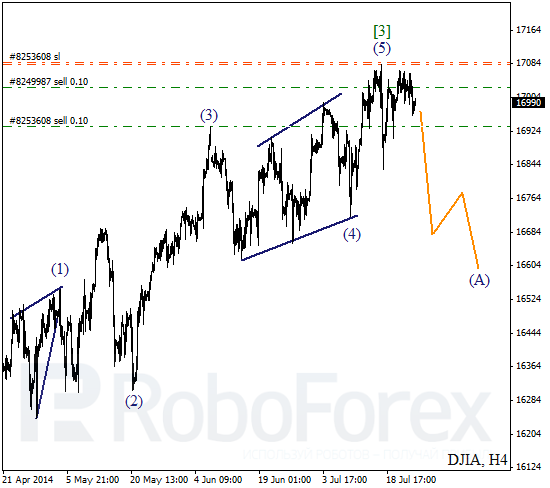
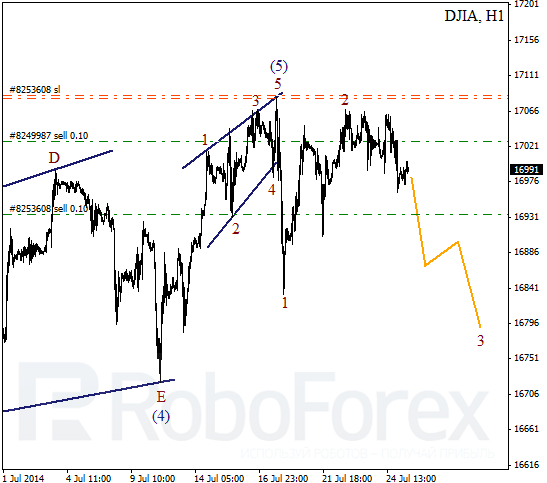
More detailed wave structure is shown on H1 chart. Probably, wave (5) was completed in the form of diagonal triangle pattern. On minor wave level, instrument formed several bearish impulses. Later instrument is expected to continue falling down inside wave 3.
Crude Oil
Oils is still being corrected. Earlier, price completed descending impulse inside wave 1 or A. It looks like current ascending correction is going to continue for the entire next week.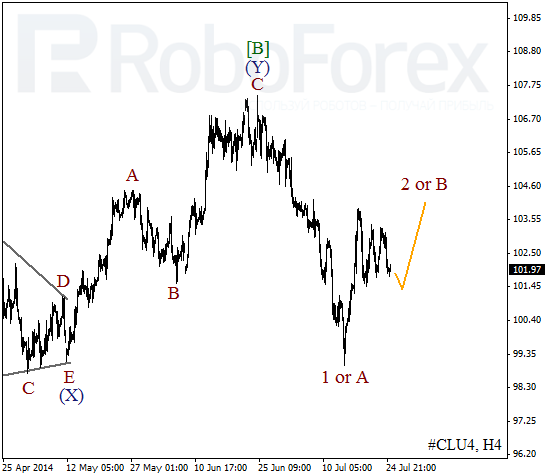
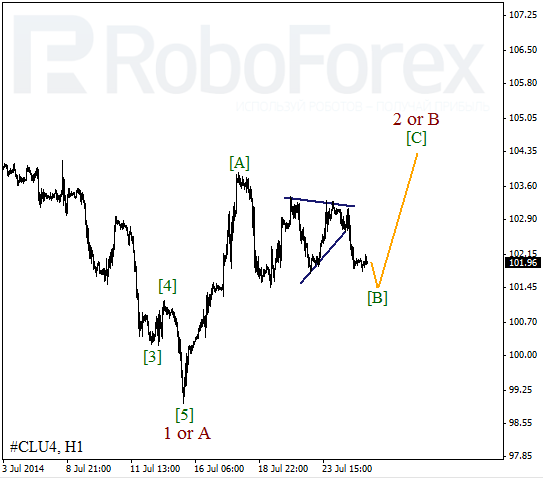
As we can see at the H1 chart, after finishing fast impulse inside wave [A], Oil started correction. It looks like price formed triangle pattern inside wave [B]. In the near term, instrument is expected to complete correction and start growing up inside wave [C].
RoboForex Analytical Department
Attention!
Forecasts presented in this section only reflect the author’s private opinion and should not be considered as guidance for trading. RoboForex bears no responsibility for trading results based on trading recommendations described in these analytical reviews.