Wave Analysis 22.09.2014 (DJIA Index, Crude Oil)
22.09.2014
Analysis for September 22nd, 2014
DJIA Index
The DJIA Index is about to complete diagonal triangle inside wave 5. On lower levels, the price is forming a bullish impulse inside wave (C). Possibly, during the next several days the price may try to reach a new historic maximum and then start a new correction. 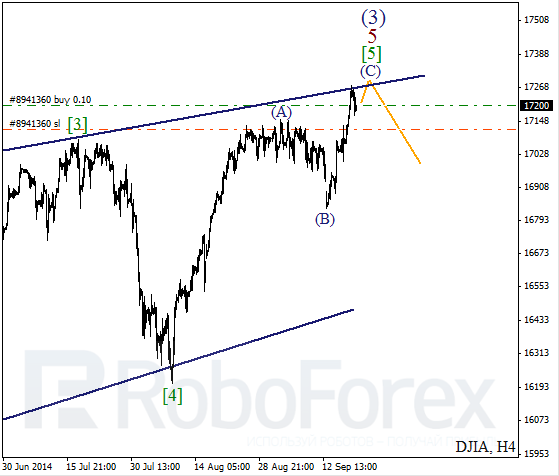
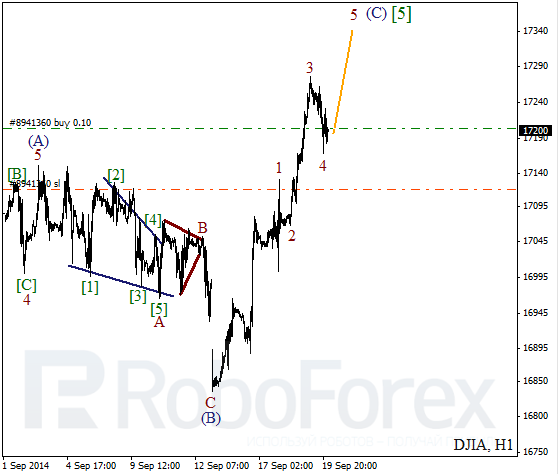
More detailed wave structure is shown on H1 chart. After finishing zigzag inside wave (B), the DJIA Index started forming an ascending impulse, inside which right now the price is completing the fourth wave. In the near term, the market is expected to start growing inside the fifth wave.
Crude Oil
After rebounding several times from the channel’s upper border, Oil is starting to fall again. It looks like the market is moving downwards inside wave [5] of 3. It’s quite possible that the price may break the previous minimum by the end of this trading week.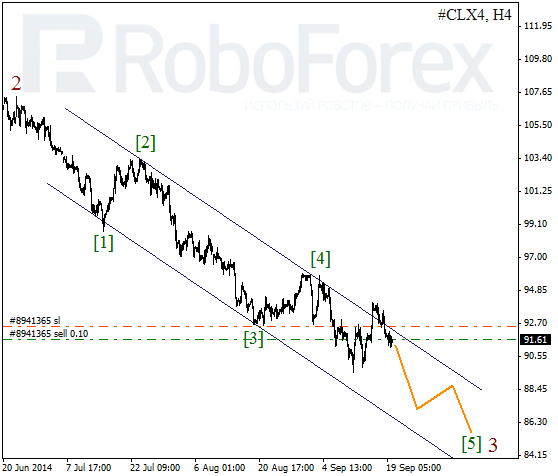
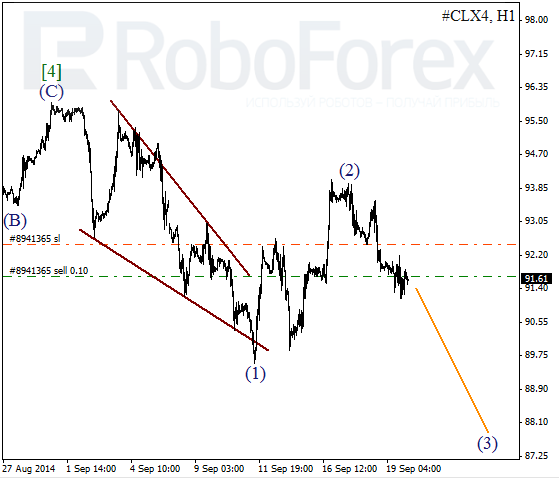
More detailed wave structure is shown on H1 chart. Probably, Oil has formed a bearish wedge pattern inside wave (1). After completing the second wave in the form of zigzag last week, the price is expected to continue falling inside the third one.
RoboForex Analytical Department
Attention!
Forecasts presented in this section only reflect the author’s private opinion and should not be considered as guidance for trading. RoboForex bears no responsibility for trading results based on trading recommendations described in these analytical reviews.