Wave Analysis 22.08.2014 (DJIA Index, Crude Oil)
22.08.2014
Analysis for August 22nd, 2014
DJIA Index
A fast ascending movement of Index forces us to change the chart structure. As we can see at the weekly chart, the market is growing quite steadily and moving close to its historic maximums. Considering that right now the growth is already slowing down a little bit, we may assume that the price is forming a diagonal triangle pattern inside wave 5. Thus, in the nearest future, Index may reach a new all-time high and then start a new correction.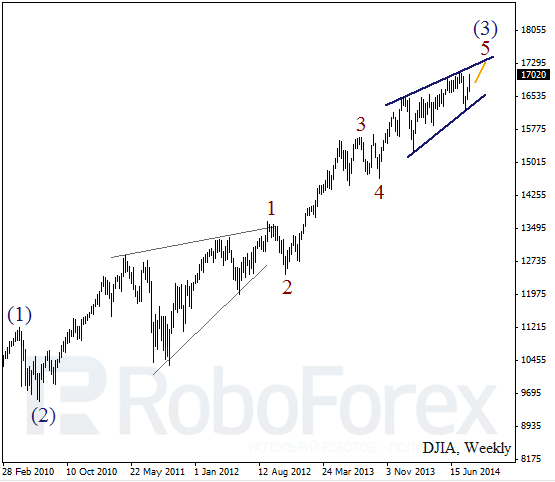
Crude Oil
The weekly chart of Oil implies that the price continues forming a horizontal triangle with wave [C] inside it. It looks like bears are going to break the minimum of wave (A). Consequently, later the market may fall significantly inside wave (C) of [C].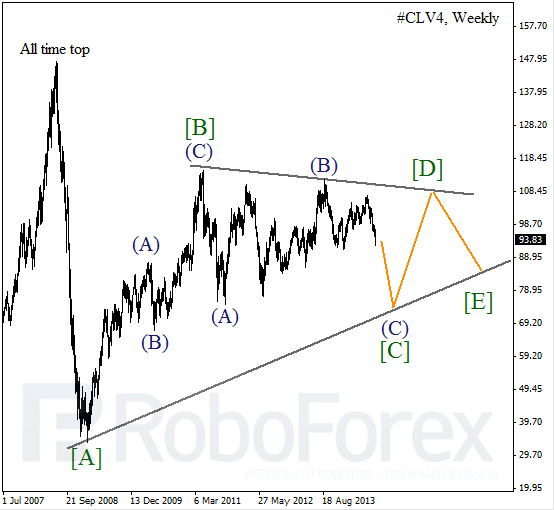
RoboForex Analytical Department
Attention!
Forecasts presented in this section only reflect the author’s private opinion and should not be considered as guidance for trading. RoboForex bears no responsibility for trading results based on trading recommendations described in these analytical reviews.