The pair continues falling. USD/CAD wave analysis
24.11.2014
Analysis for November 24th, 2014
In our previous review, “Beginning of a descending zigzag. Wave analysis of USD/CAD for 14.11.2014”, we discussed one of the possible scenarios how the price may form a descending zigzag(c) of [iv].
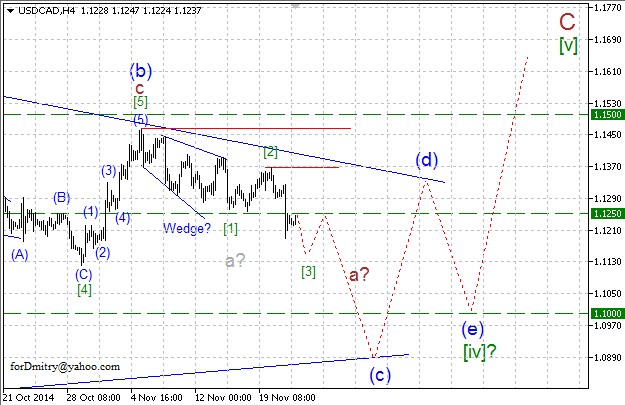
The wave structure on the H4 chart implies that the price continues forming a descending zigzag (c) of [iv]. Right now, the pair is forming its first “leg” a of (c).
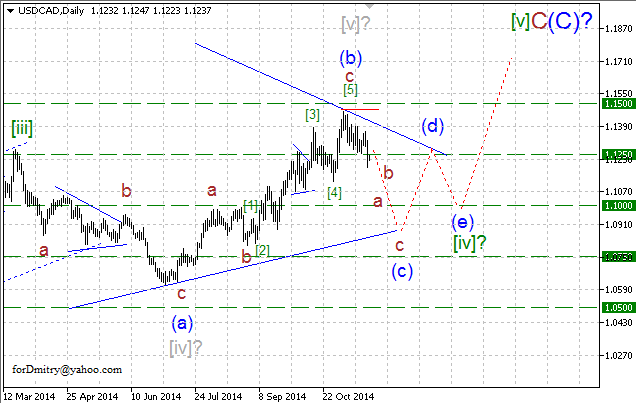
Our mid-term expectations haven’t changed so far. The market continues forming a descending correction [iv] of C of (C), which is probably taking the form of a running horizontal pattern. Possibly, the pair has already started forming its descending zigzag(c) of [iv] with the target lower than 1.100. If this assumption is correct, then after this triangle[iv] of C, the market may make the final ascending movement inside wave [v] of C.
However, at the same time one should remember that any possible scenario is subjective and the market may move in a completely different direction.
RoboForex Analytical Department
Attention!
Forecasts presented in this section only reflect the author’s private opinion and should not be considered as guidance for trading. RoboForex bears no responsibility for trading results based on trading recommendations described in these analytical reviews.