Wave Analysis for 2013 (DJIA Index, Crude Oil)
19.01.2013
Yearly Analysis for 2013
DJIA Index
While many people are expecting the Index to move downwards a lot, I try to stay positive. We may assume that over the last 4 years the Index has been forming an initial impulse inside wave (1). The year of 2013 may become a year of a correction. The target is approximately at the level of 11000 pips.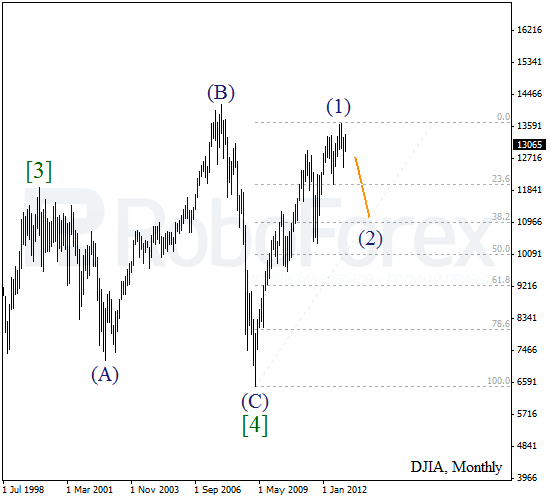
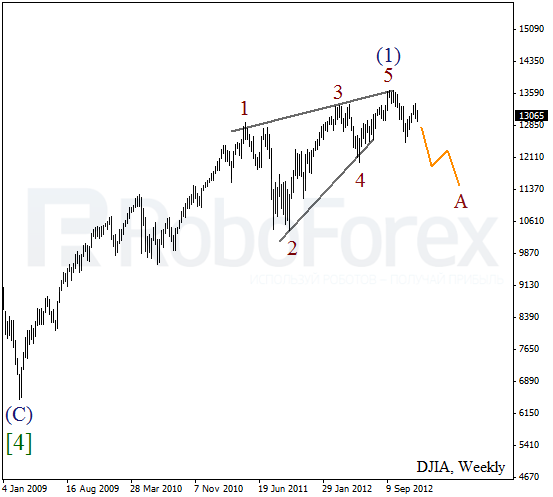
As we can see at the weekly chart, the price completed an ascending wedge pattern inside wave (1). On the minor wave level the Index is forming a descending impulse inside wave A. We can’t exclude a possibility that in the future the instrument may continue moving downwards.
Crude Oil
After making a significant descending movement, Oil has been consolidating inside wave [B] for several years already. We can’t exclude a possibility that the price may have already completed an impulse inside wave [C]. This year the market may start a new descending movement towards a local minimum.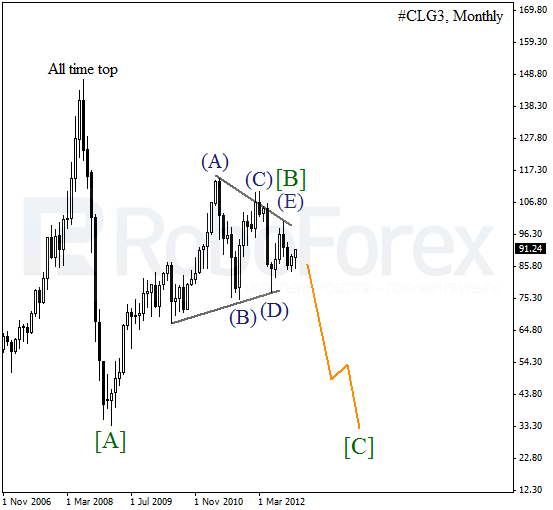
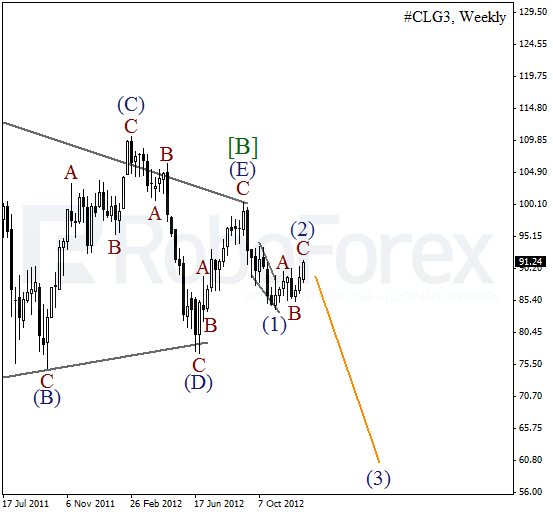
After finishing wave (E) at the weekly chart, Oil completed a bearish wedge pattern inside wave (1). At the moment the instrument is finishing zigzag pattern inside the second wave. Most likely, in the future the price will start forming a new descending movement inside the third wave.
RoboForex Analytical Department
Attention!
Forecasts presented in this section only reflect the author’s private opinion and should not be considered as guidance for trading. RoboForex bears no responsibility for trading results based on trading recommendations described in these analytical reviews.