Murray Math Lines 21.03.2013 (USD/CAD, NZD/USD, EUR/GBP)
21.03.2013
Analysis for March 21st, 2013
USD/CAD
The market is slowly moving inside an “overbought zone”; the price returned to the 8/8 level. Earlier the Super Trends’ lines formed “bullish cross”. If the market rebounds from the current levels, the price will start a new ascending movement and break a local maximum.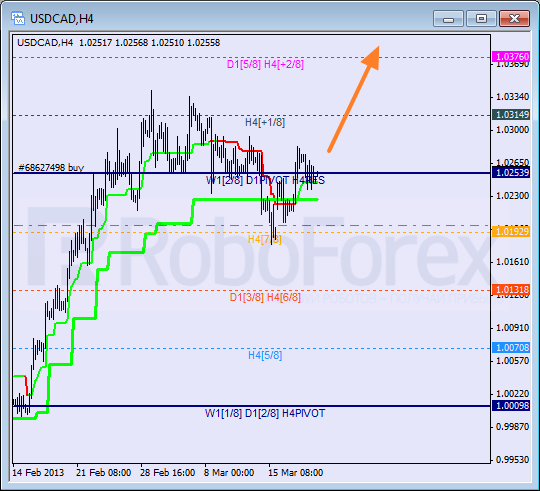
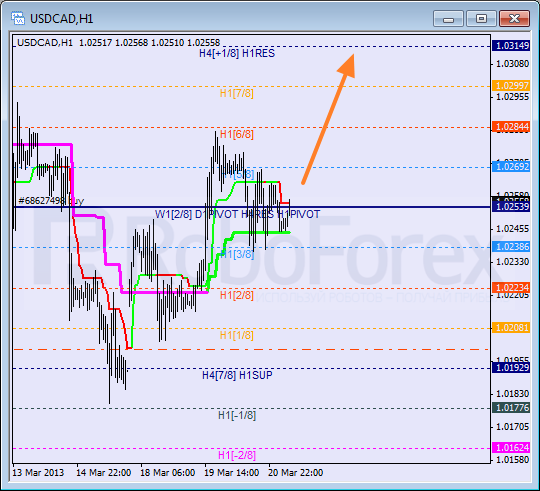
At the H1 chart we can see that that the pair is stuck between the Super Trends’ lines. If the bulls are able to keep the price above the 5/8 level, the pair will continue growing up. A local target for the buyers is at the 8/8 level.
NZD/USD
New Zealand Dollar is still consolidating between the Super Trends’ lines. If the market is able to break the 3/8 level and the H4 Super Trend, and to keep the price below them, the bears will continue pushing it downwards. The target is at the 0/8 level.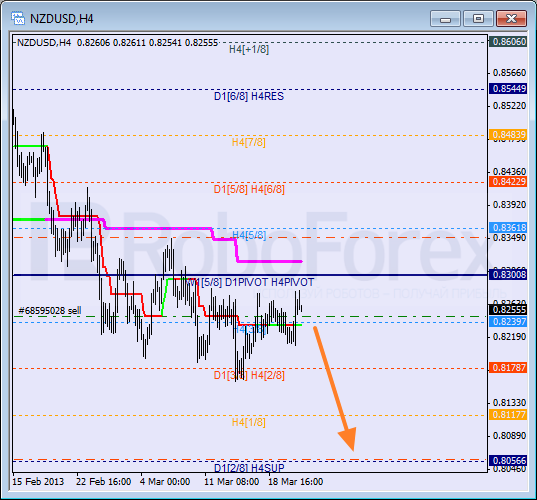
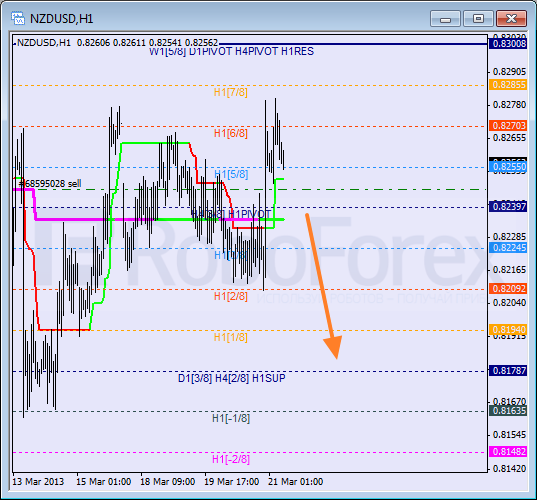
At the H1 chart we can see that the pair rebounded from the 6/8 level, which means that the bulls are becoming weaker. If the bears break the 4/8 level, the price will start a new descending movement. The short-term target for the bears is still at the 0/8 level.
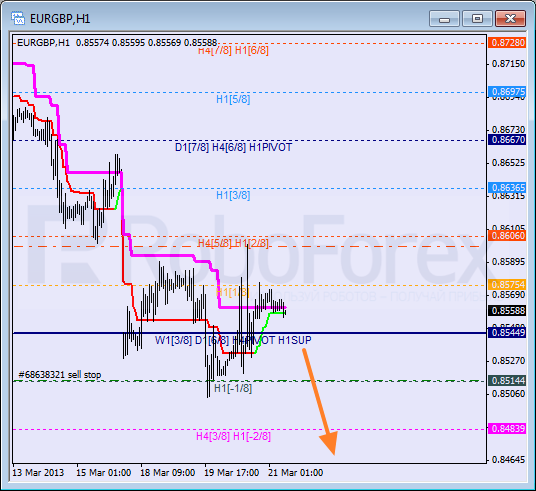
EUR/GBP
Yesterday during the correction the pair “touched” the stop on my sell order. Right now it’s quite risky to enter the market, that’s why I decided to place a pending order. If the bears are able to keep the price below the 3/8 level, the pair will continue falling down towards the main target, which is at the 0/8 level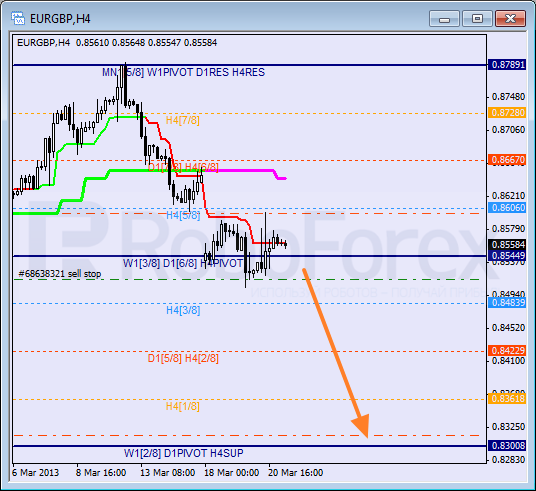
At the H1 chart the bears were supported by the 2/8 level and the price started a new descending movement. If the market enters an “oversold zone” again, the pair will break the -2/8 level and the lines at the chart will be redrawn.
RoboForex Analytical Department
Attention!
Forecasts presented in this section only reflect the author’s private opinion and should not be considered as guidance for trading. RoboForex bears no responsibility for trading results based on trading recommendations described in these analytical reviews.