Japanese Candlesticks Analysis 03.03.2015 (EUR/USD, USD/JPY)
03.03.2015
Analysis for March 3rd, 2015
EUR USD, “Euro vs. US Dollar”
The H4 chart of EUR USD shows a sideways correction within the downtrend. Three Line Break chart indicates the downtrend; Heiken Ashi candlesticks confirm that the correction continues.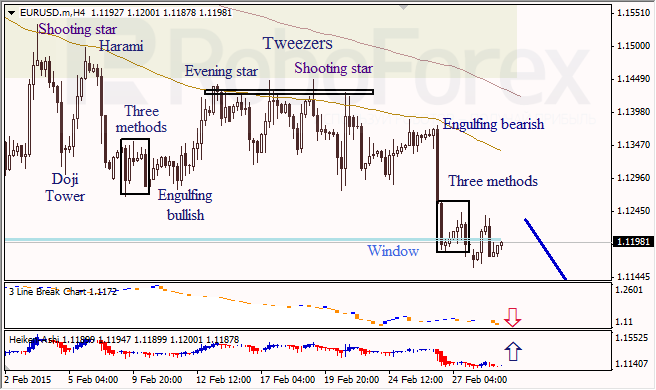
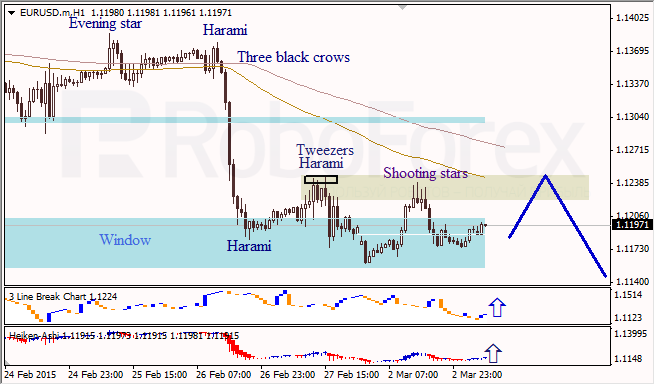
As we can see at the H1 chart of EUR USD, the price has been supported by the lower Window. Three Line Break chart and Heiken Ashi candlesticks indicate that an ascending correction continues.
USD JPY, “US Dollar vs. Japanese Yen”
At the H4 chart of USD JPY, the price has formed bearish reversal pattern, Evening Star Doji, near the upper Window. Bullish Three Methods pattern may provide support. Three Line Break chart and Heiken Ashi candlesticks indicate a descending movement.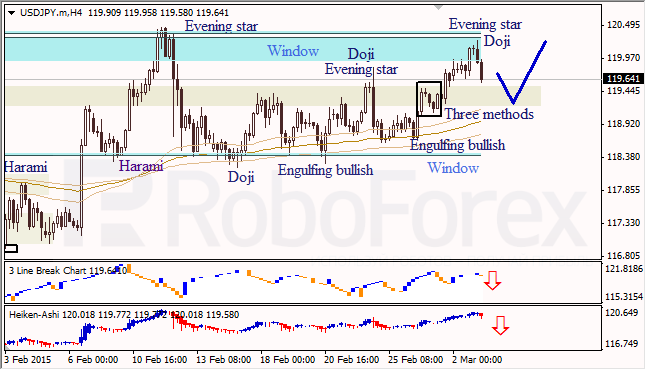
RoboForex Analytical Department
Attention!
Forecasts presented in this section only reflect the author’s private opinion and should not be considered as guidance for trading. RoboForex bears no responsibility for trading results based on trading recommendations described in these analytical reviews.