Japanese Candlesticks Analysis 12.09.2014 (EUR/USD, USD/JPY)
12.09.2014
Analysis for September 12th, 2014
EUR USD, “Euro vs US Dollar”
At the H4 chart of EUR USD, a correction within the downtrend indicated by Doji and Inverted Hammer patterns continues, but the price hasn’t broken the level of a bearish Three Methods pattern. Three Line Break chart and Heiken Ashi candlesticks confirm the downtrend.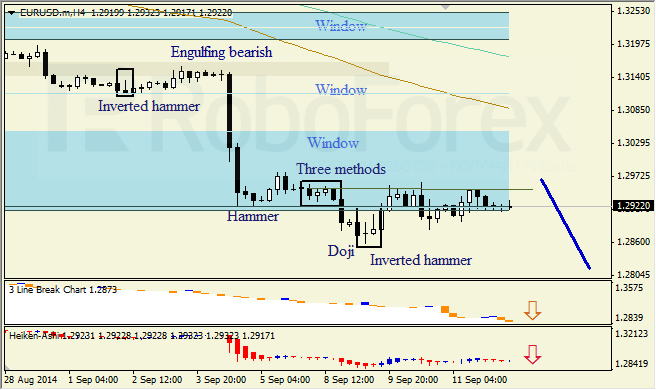
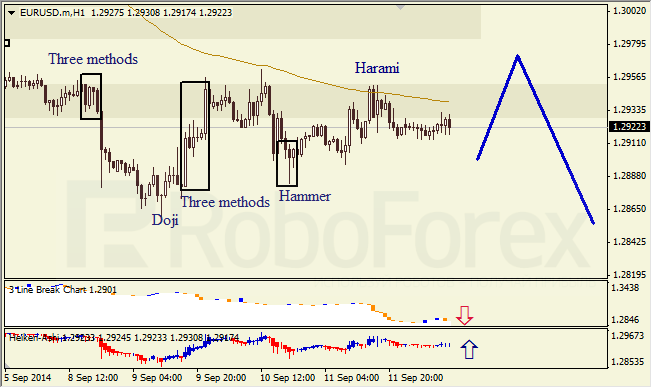
The H1 chart of EUR USD shows a sideways correction within the downtrend, which is indicated by Doji pattern. Three Line Break chart shows the downtrend; Heiken Ashi candlesticks confirm that the correction continues.
USD JPY, “US Dollar vs Japanese Yen”
The H4 chart of USD JPY shows a bullish tendency within the uptrend. The price may form bearish patterns at the resistance level. Three Line Break chart and Heiken Ashi candlesticks confirm an ascending movement.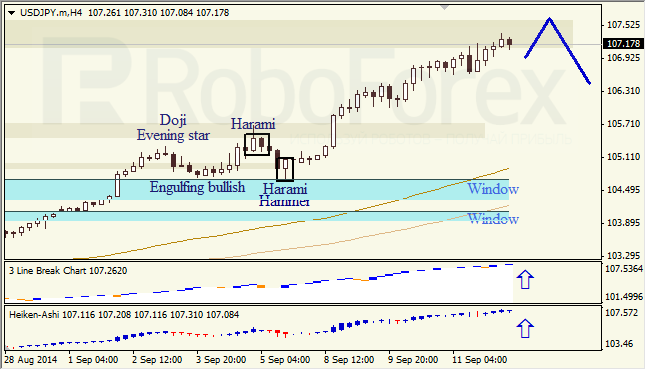
RoboForex Analytical Department
Attention!
Forecasts presented in this section only reflect the author’s private opinion and should not be considered as guidance for trading. RoboForex bears no responsibility for trading results based on trading recommendations described in these analytical reviews.