Japanese Candlesticks Analysis 01.09.2014 (EUR/USD, USD/JPY)
01.09.2014
Analysis for September 1st, 2014
EUR USD, “Euro vs US Dollar”
At the H4 chart of EUR USD, the price faced resistance from the middle Window and then, after Evening Star pattern, the downtrend continued. Three Line Break chart and Heiken Ashi candlesticks confirm a bearish movement; Doji pattern and support from the closest Window indicate a possibility of a bullish pullback.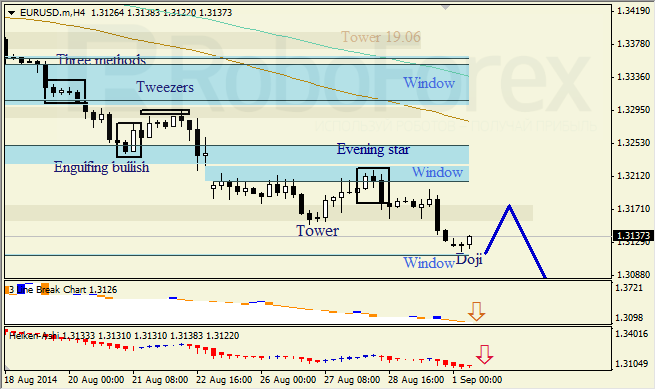
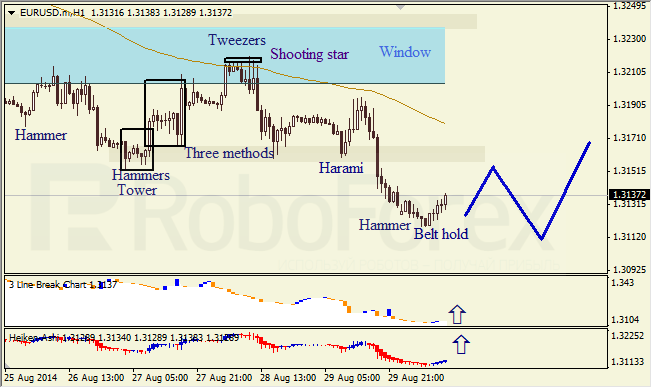
The H1 chart of EUR USD shows an ascending correction, which is confirmed by Hammer and Belt Hold patterns along with Three Line Break chart and Heiken Ashi candlesticks.
USD JPY, “US Dollar vs Japanese Yen”
The H4 chart of USD JPY shows a sideways correction within the uptrend. A new Window is broken upwards and may provide support. Three Line Break chart and Heiken Ashi candlesticks confirm a bullish movement.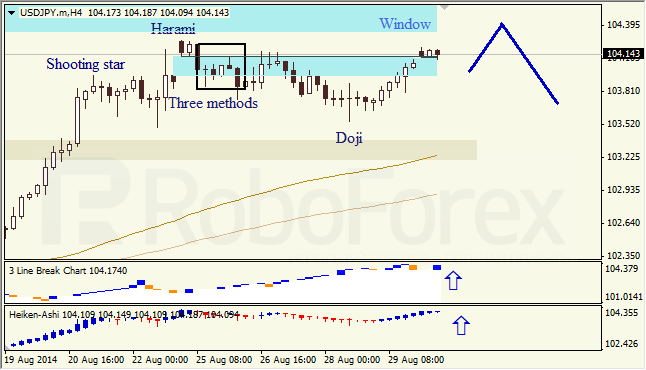
RoboForex Analytical Department
Attention!
Forecasts presented in this section only reflect the author’s private opinion and should not be considered as guidance for trading. RoboForex bears no responsibility for trading results based on trading recommendations described in these analytical reviews.