Japanese Candlesticks Analysis 20.08.2014 (EUR/USD, USD/JPY)
20.08.2014
Analysis for August 20th, 2014
EUR USD, “Euro vs US Dollar”
The H4 chart of EUR USD shows the downtrend. Bearish candlesticks broke the closest Window, but under the Window there is a strong support level from last year’s June Tower pattern. Three Methods pattern, Three Line Break chart, and Heiken Ashi candlesticks confirm a bearish movement, but taking into account the support level, the pair may soon start an ascending correction.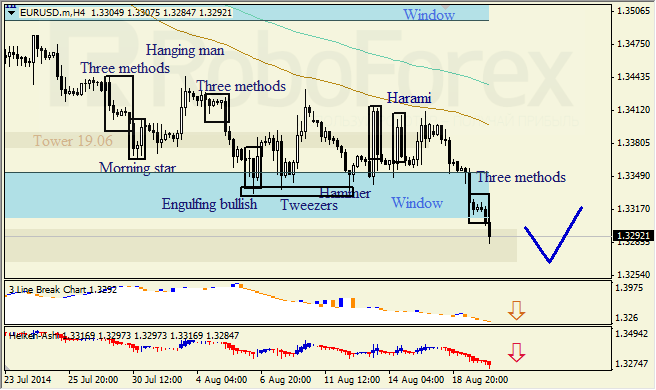
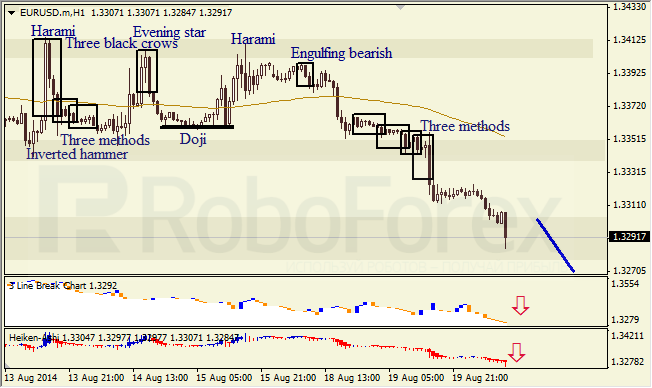
The H1 chart of EUR USD shows a bearish tendency, which continued after several similar Three Methods patterns. Three Line Break chart and Heiken Ashi candlesticks confirm that a descending tendency continues.
USD JPY, “US Dollar vs Japanese Yen”
The H4 chart of USD JPY shows the uptrend. The price formed the 10th maximum after the previous correction, which means that a new correction may start soon. Three Line Break chart and Heiken Ashi candlesticks confirm an ascending movement.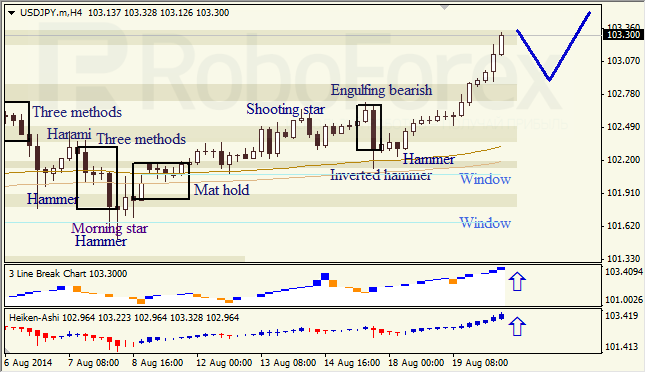
RoboForex Analytical Department
Attention!
Forecasts presented in this section only reflect the author’s private opinion and should not be considered as guidance for trading. RoboForex bears no responsibility for trading results based on trading recommendations described in these analytical reviews.