Japanese Candlesticks Analysis 23.07.2014 (EUR/USD, USD/JPY)
23.07.2014
Analysis for July 23rd, 2014
EUR USD, “Euro vs US Dollar”
H4 chart of EUR USD shows descending trend, which continued after Engulfing Bearish and Three Methods patterns. Closest Window was broken; now it’s resistance level. Three Line Break chart and Heiken Ashi candlesticks confirm descending movement.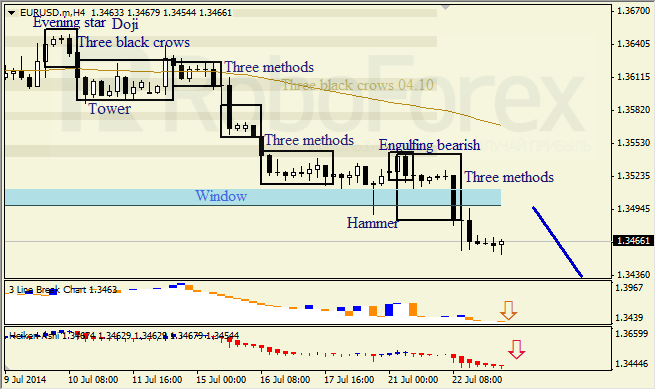
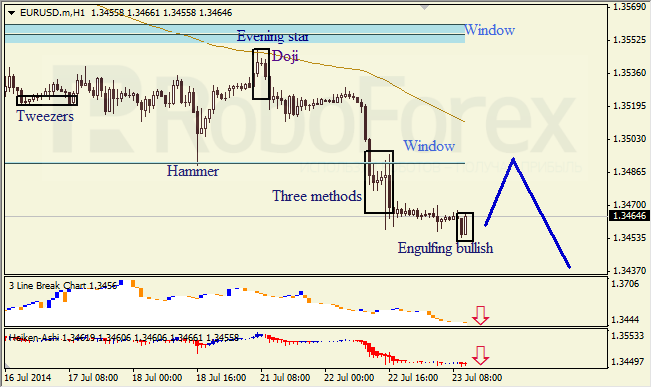
H1 chart of EUR USD shows sideways correction. Engulfing Bullish pattern indicates that ascending correction continues. Three Line Break chart and Heiken Ashi candlesticks confirm descending trend.
USD JPY, “US Dollar vs Japanese Yen”
H4 chart of USD JPY shows descending trend, which continued after Engulfing Bearish pattern. Three Line Break chart indicates correction; Heiken Ashi candlesticks confirm bearish movement.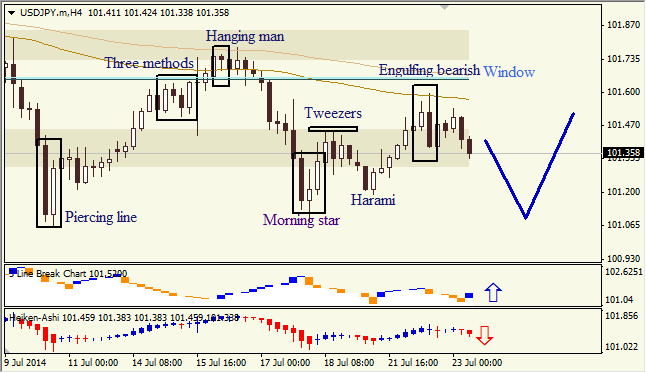
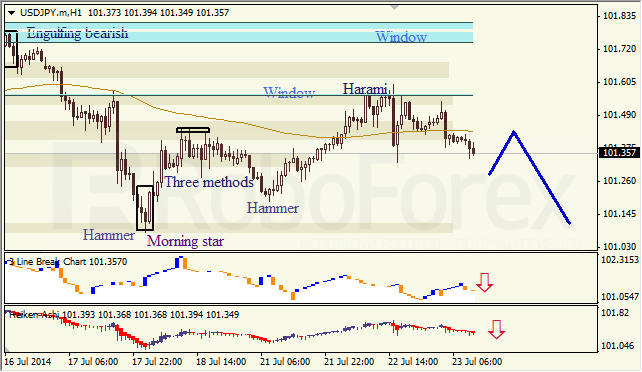
H1 chart of USD JPY shows resistance from closest Window. Three Line Break chart and Heiken Ashi candlesticks confirm descending movement.
RoboForex Analytical Department
Attention!
Forecasts presented in this section only reflect the author’s private opinion and should not be considered as guidance for trading. RoboForex bears no responsibility for trading results based on trading recommendations described in these analytical reviews.